 RSS Subscribe
Gold had worst October since 2008, but fundamentals still bullish – Richard Mills
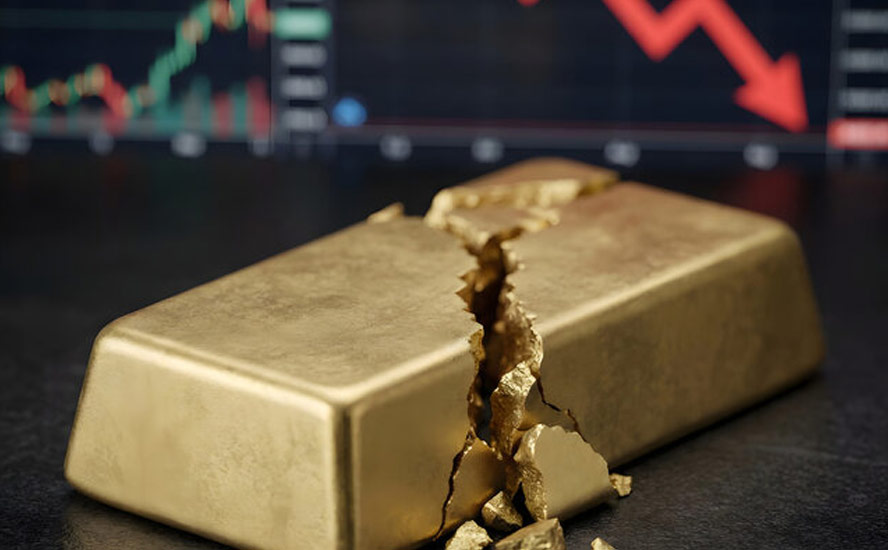
These are trying times for gold enthusiasts.
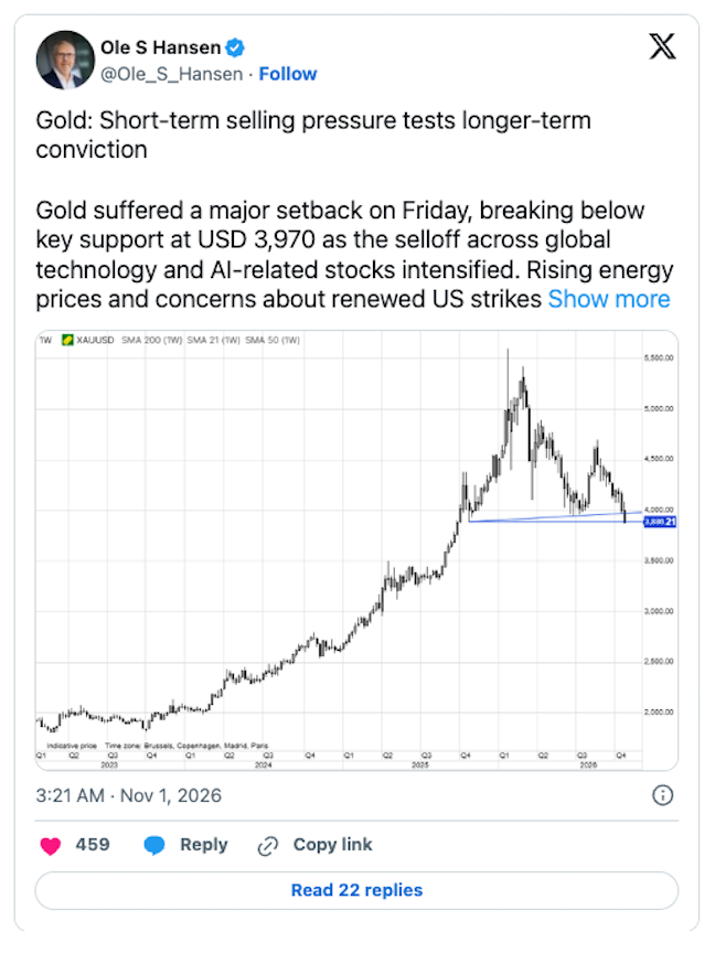
The last trading day of October saw gold break below key support at USD$3,970, as a selloff across technology and AI-related stocks intensified.
As reported by Ole Hansen, head of commodity strategy at Saxo Bank, Rising energy prices and concerns about renewed US strikes against Iran after the midterm elections added to inflation worries and weakened risk appetite. Gold closed below USD 3,900, a one-year low, completing its worst October since the global financial crisis with a 12.7% decline.
Gold selling could deepen the rout, Hansen warned. He noted that 6 tonnes flowed out of gold ETFs in the week of Oct. 19-23, and while that is small compared to the 150 tonnes accumulated since July, with recent purchases now underwater, investors’ willingness to maintain exposure will be an important test of their longer-term bullish conviction. Further liquidations could deepen and prolong the correction.
Hedge funds have been net sellers for nine consecutive weeks.
The broader equity selloff adds another risk, particularly if investors are forced to raise cash by liquidating otherwise attractive holdings, Hansen wrote.
But it could also bring investors back to gold. The reason?
A deeper equity correction could eventually shift attention towards potential Federal Reserve support. Expectations for further rate hikes have already eased from three to two, with additional market stress potentially removing the remaining hikes. A weaker dollar and renewed concerns about fiscal and inflation credibility could eventually provide support for bullion.
In Hansen’s view, The longer-term investment case for bullion remains intact. Rising government debt, fiscal sustainability concerns, geopolitical fragmentation and de-dollarization continue to support gold’s role as a portfolio diversifier. However, these structural drivers are currently insufficient to offset technical selling, reduced risk appetite and concerns that persistent energy-driven inflation could keep monetary policy restrictive…
The structural reasons for holding gold have not disappeared, but stabilization in market sentiment and positioning may be needed before they regain influence over prices.
Watch a video by Payscope Daily for a quick analysis of the Oct. 30th rout. It says last quarter, investors poured a record $31 billion into gold ETFs. Why didn’t the support hold? Three reasons. “First, cash. Commerzbank says margin calls may have forced investors who lost on tech to sell their gold. Second, oil. Iran war fears pushed Brent up 13.6% in October, and inflation worries rose with it. Third, rates. The Fed hiked in September and signaled one more. A 10-year Treasury pays 5%. Gold pays nothing. The same thing happened in 2020. Gold fell over 10% in the March panic. By August, it hit a record. This time, the next test is the Fed’s December meeting.”
Unfortunately, things haven’t gotten any better for gold since Oct. 30. On Monday, Nov. 16, the precious metal sunk to $3,830.74 an ounce, its worst showing since Oct. 2, 2025, and 31.5% below the January 2026 all-time high of $5,594.82. If the trend continues, gold is on track for its worst year since 2015.
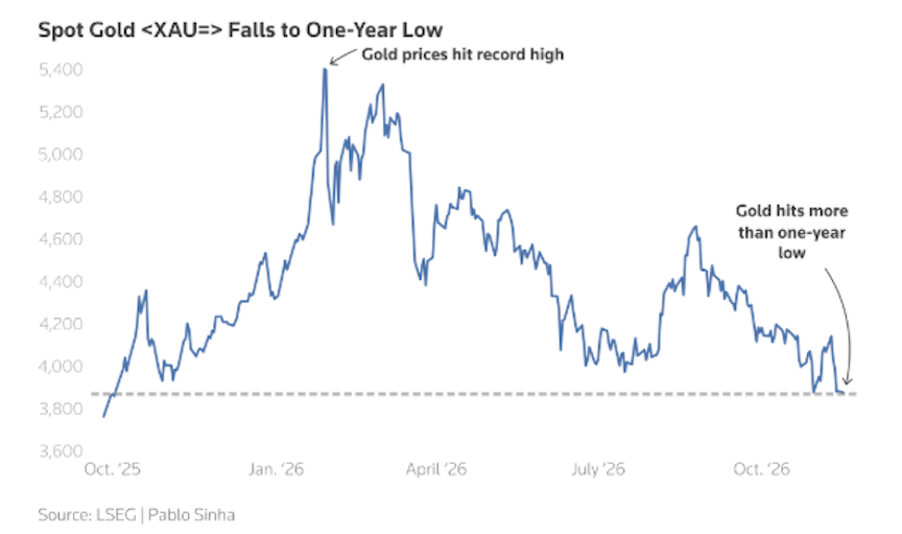
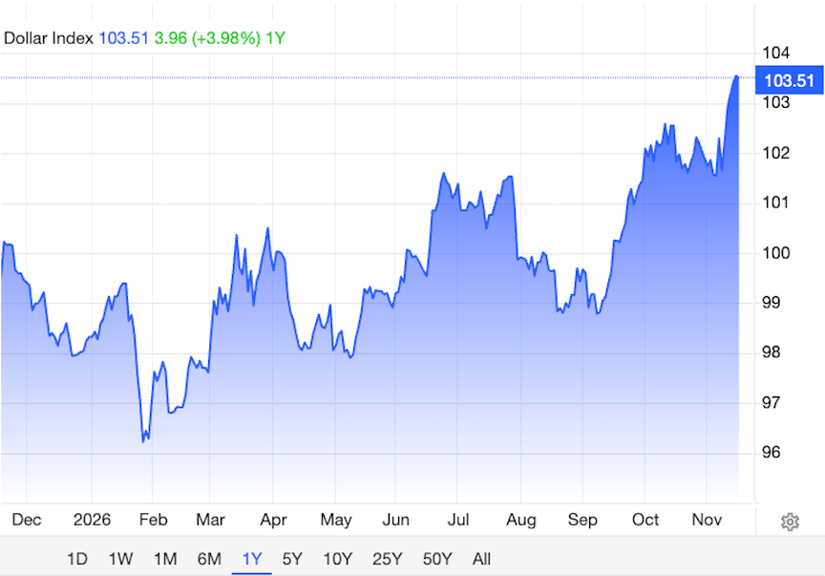
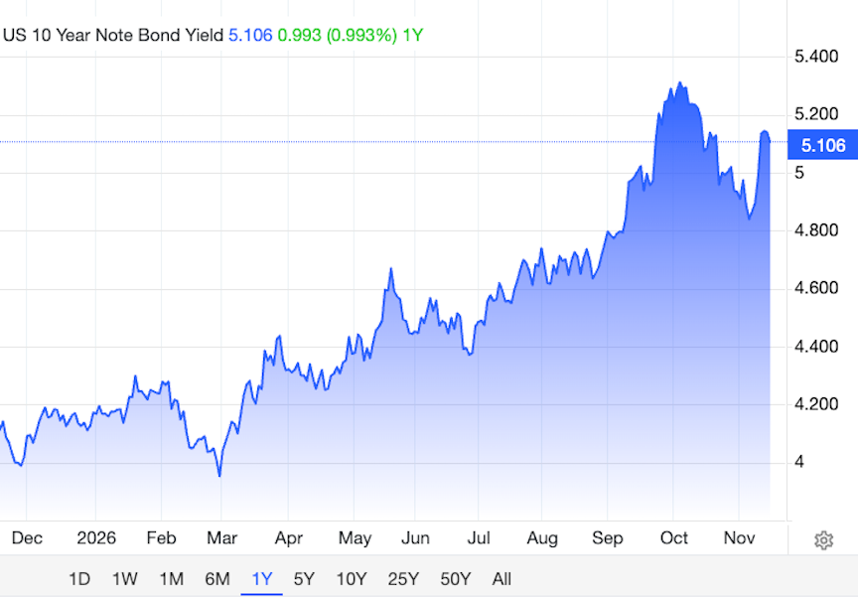
Sources quoted by Reuters named high US Treasury yields and the surging US dollar as the headwinds slowing gold down.
The US dollar, which is hovering near its highest since April 2025, has made dollar-priced bullion more expensive for holders of other currencies, weighing on demand for gold in recent months.
Treasury yields have jumped on expectations the Federal Reserve will hike interest rates by 25 basis points at its next meeting in December with a small chance of a 50-basis-point rise, according to CME’s FedWatch Tool.
Kitco News columnist Gary Wagner weighed in on the carnage.
He noted that the fresh 52-week low brought gold to $3,835 at the close of trading Monday for a loss of $28.60 or 0.74% on the day.
Normally a decline in crude oil is bullish for precious metals because it lessens the chances of another rate hike to cool inflation. But that’s not what happened on Monday. Despite crude oil shedding roughly 4%, “it offered little cushion to falling prices in gold and silver,” Wagner wrote.
Ditto for Treasury yields. Despite the 10-year slipping two basis points to 5.12% and the 2-year easing to 4.82%, gold failed to bounce.
According to Wagner, “The metals fell anyway because the bigger picture has not changed.” That includes around 90% odds of a December rate hike, and a US dollar index at its strongest level since April 2025.
Technical analysis by Wagner suggests “Gold must reclaim $3,880 and silver $48 before either chart shows any repair, and until that happens the path of least resistance remains lower, with the round number at $3,800 the next obvious test for gold and no level of technical support until roughly $3,500.”
Goldmoney offers some more insight into gold’s demise and what could be coming down the pipeline, no pun intended. It starts with the fact of rising bond yields increasing the cost of gold ownership, hance the markdowns in gold and silver.
Traders will have to simply sit through this nonsense until the so-called debasement trade is judged to be back on.
Gold interest rate trade dead, long live the debasement trade — AOTH
Investors need higher yields to compensate for the loss of purchasing power, which is being driven not only by growing government deficits, but continuing oil shipment disruptions through the Strait of Hormuz.
Goldmoney’s chart below goes against US claims that shipping has nearly returned to normal.
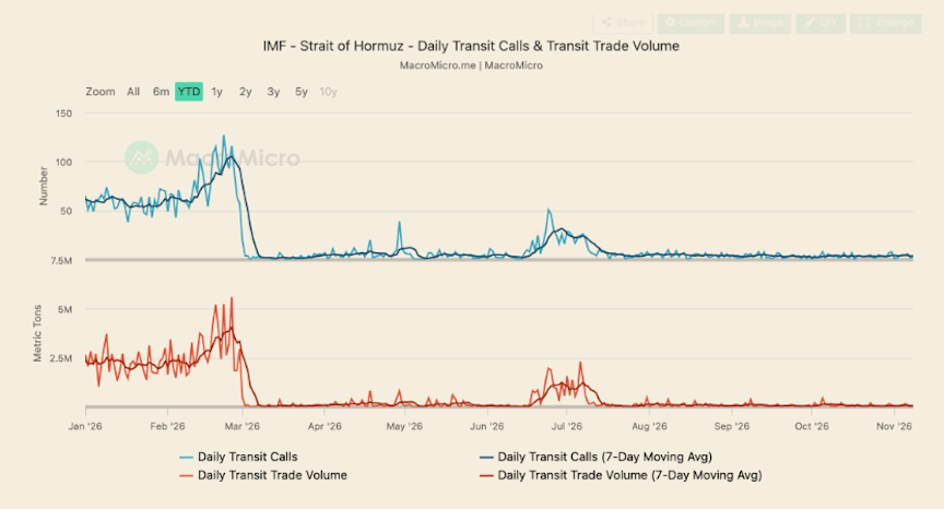
Daily transit calls and daily transit trade volumes rose in July but have since fallen to near zero. The US continues to attack Iran, shipping remains badly disrupted, and the Houthis have effectively closed the pipeline from from Ras Tanura to Yanbu on the Red Sea by damaging pumping stations and the pipeline itself.
About the only oil escaping the region is through the UAR’s pipeline to Fujairah with a maximum capacity of about 2mbpd.
The next logical leap is what this means for inflation, which currently sits at 3.7% — almost double the Fed’s 2% target.
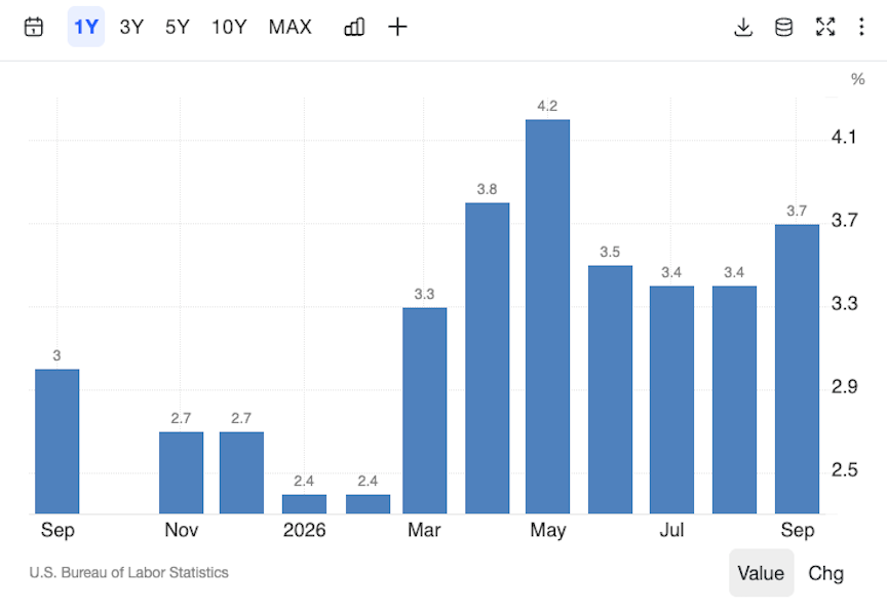
If the Fed is to meet its inflation goal, its only option is to raise interest rates. The problem for the Fed, according to Goldmoney, is that higher rates and continued high consumer price inflation could push the economy into recession.
Here’s how it could happen, and what it could mean for precious metals: Higher bond yields create a crisis in equities which are in an extended bubble.
If that implodes, the negative feedback into economic activity in the non-financial economy will rival that of the 1929—1932 bear market, which lost 89% top to bottom, becoming a major driver of the Great Depression.
At some point in this process of rising bond yields markets will realise that events are leading to a destabilisation of credit values, and not of gold. Our guess is that a further rise in the 10-year US note yield towards 5.5% will be enough to tip the scales. That’s only 35 basis points above the current level and could occur in the space of not many days.
That being the case, we will almost certainly see gold and silver suddenly shoot higher.
Real interest rates
The demand for gold moves inversely to interest rates — the higher the rate of interest the lower the demand for gold, the lower the rate of interest the higher the demand for gold.
The reason for this is simple. When real interest rates are low, at, or below zero, cash and bonds fall out of favor because the real return is lower than inflation – if you’re earning 1.6% on your money but inflation is running 2.7% the real rate you are earning is negative 1.1% – an investor is actually losing purchasing power. Gold is the most proven investment to offer a return greater than inflation (by its rising price) or at least not a loss of purchasing power.
There’s a saying that “6% interest can draw gold from the moon,” undoubtedly true, but rates below 2% draw investors to gold.
Six percent can draw gold from the moon
The US 10-year Treasury bond currently yields 5.10%. The inflation rate is 3.7% so the real interest rate is 1.4%. Bond yields need to fall significantly for gold to make sense as an investment when compared to currently high-yielding bonds.
Could that actually happen? Didn’t we just say there’s a 90% chance of the Fed raising rates in December? Well, yes, but analysts are looking beyond 2026, and what they see are interest rate cuts.
In a research note published Tuesday, Nov. 17, Goldman Sachs analysts said Fed rate hikes — a 25-basis-points raise in December followed by another hike in March of 2027 — will weigh on private investor demand for gold, even as structural central bank demand supports a firm floor beneath prices.
The analysts forecast an $800 rise in the gold price next year, rising to $4,650 by the end of 2027, which much of the increase coming on the back of continued central bank purchases. (Kitco News)
Goldman Sachs, says Kitco, assumes central banks will average 60 tonnes per month in gold purchases from 2026 through 2028, compared to a pre-2022 average of 17 tonnes.
But if gold is to reclaim its record-high $5,600 by the end of 2028, the Fed will have to pivot to rate cuts:
Goldman expects four 25-basis-point cuts between November 2027 and September 2028, which would lower the Fed funds rate to 3.25%-3.5%, removing the elevated opportunity cost of holding gold and bringing rate-sensitive Western ETF investors back into the market.
Remember real interest rates need to be zero or negative to push investors out of bonds and into gold. That would imply a 10-year yield of roughly 2% if inflation falls to within the Fed’s 2% target.
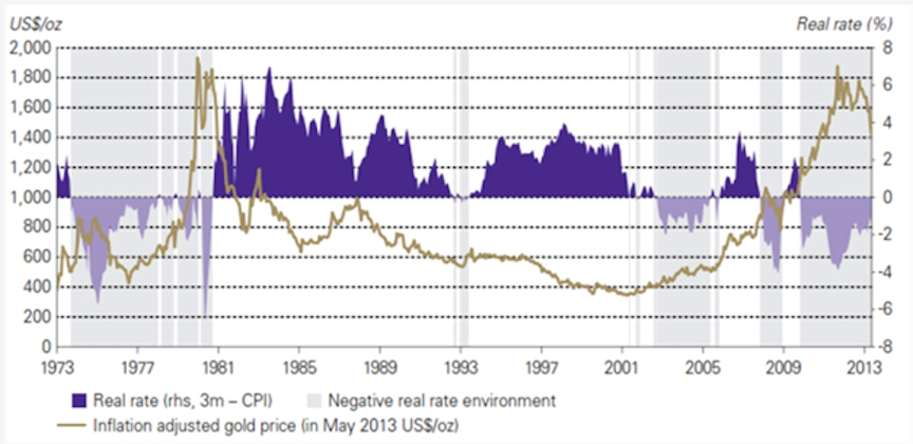
Historically, we can see the inverse relationship between negative real interest rates and gold, by charting the gold price and the 10-year Treasury’s yield after inflation.
In an article titled ‘The Golden Dilemma’, authors Claude Erb and Campbell found a near-perfect negative correlation of -0.82 (-1 being a perfect negative correlation) between real interest rates and gold prices between 1997 and 2012. Going back further in history, when real interest rates turned negative during the second half of the 1970s, gold moved as high as $1,900 an ounce, as real rates plummeted as low as -6%. When Paul Volcker, Fed Chair under President Carter and Reagan, hiked short-term nominal interest rates, real rates returned to positive, ending gold’s run. In fact, the gold price continued to drift downward, reaching a 30-year low under $400 an ounce in 2001. The gold bull market of 2010 to 2013 is easily seen in juxtaposition with negative real interest rates which bottomed out at around -4% during that same period.
In the FRED chart below, notice that the gold price between 2013 and 2020 never gets above $1,400, corresponding to the period when the real yield on the 10-year is between about 0% and 1%. However, when real yields “go negative,” as they did around 2011-13, and in 2020, gold prices jumped.
2020’s 22% increase in the gold price was due to pandemic fears, combined with a low US dollar and plunging Treasury yields, causing real yields to go negative even though inflation stayed below 2%.
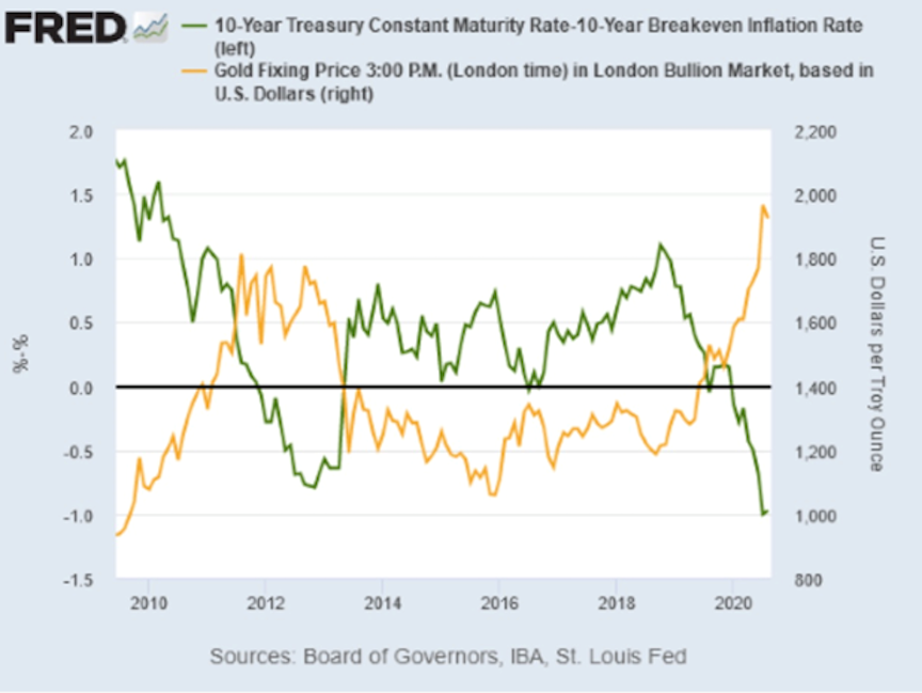
2020’s dramatic bond rally drove down yields across the world. On March 8, 2020, the US 10-year Treasury note reached an all-time low of -0.38%; two days earlier the German “bund” fell to a record -0.74%.
Investors piled into sovereign debt based on expectations of monetary stimulus like financial crisis-era easing programs that pushed down interest rates to zero and sparked a multi-year rally in stocks.
Structural trends
Let’s start with some facts. Gold has fallen sharply from its January 2026 all-time high of $5,626. As of this writing, the precious metal is trading at $3,860. That’s a loss of $1,766, or 45%, in nine months, give or take.
Gold prices are falling due to the stronger US dollar, expectations that the Federal Reserve will raise interest rates, and liquidations as investors pivot toward higher-yielding assets, like bonds.
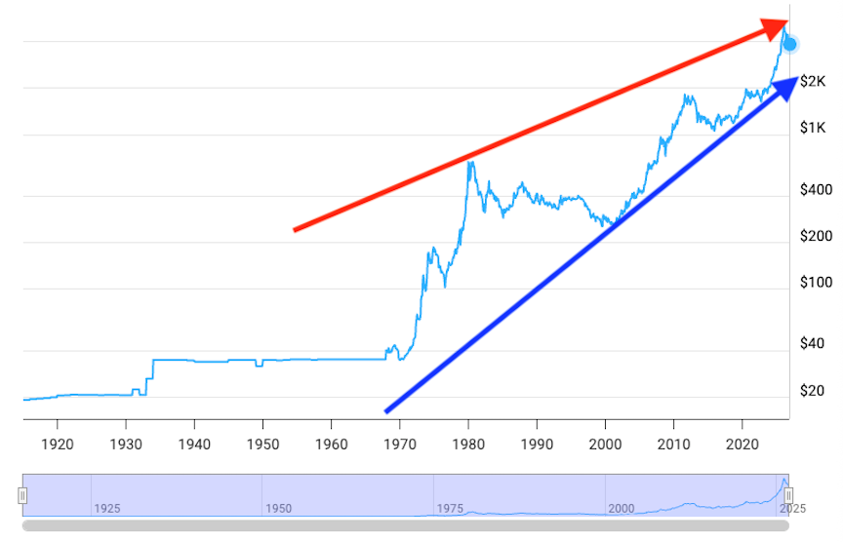
But here’s the thing. Gold has been rising and falling for the last 50 years but mostly rising. A historical gold chart shows the gold price stuck on $35 an ounce while the United States’ monetary policy was to peg the US dollar to gold. In 1971, when President Nixon removed the peg, thus ending the gold standard, gold started climbing from about $40 to about $662 in mid-1980. From there gold traded sideways for many years, but gradually it fell, to $259 in March 2001.
Gold then went on a tear for 11 years, hitting 1,728 in November 2012 before pulling back. By November 2015 it was trading at just $1,065. This bear market for gold shook out a lot of investors but the metal wasn’t done yet. From $1,065 gold climbed to $1,971 in July 2020, dipped to $1,623 in October 2022, before ascending to its most recent peak of $5,626 at the end of January 2026.
The big picture shows gold starting at $35 in 1971 and making a stepped ascent to $5,626 in 25 years, for a 160X gain or +$15,900%!
Gold is climbing a staircase — Richard Mills
Every time gold has climbed up a step it has hit a new high and each time it hit a low, the low was higher than the previous low. Remarkably, gold has never, in 50 years, crashed through a previous low. Every high has been higher than the last and every low has been higher than the last.
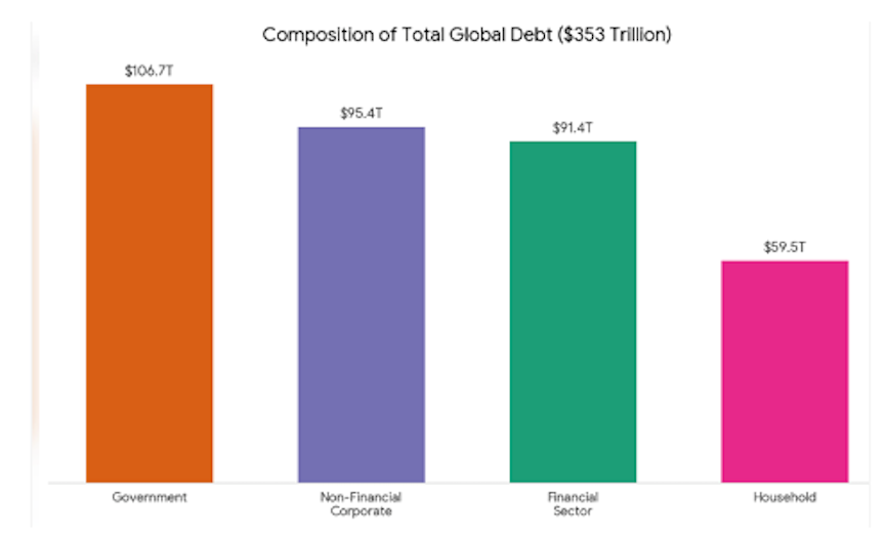
At the same time debt has expanded massively since President Nixon transitioning the world into a purely fiat monetary system. Without a hard asset constraint like gold limiting money creation, total global debt has surged to near $353 trillion, with government debt in developed economies alone climbing toward a record $75.8 trillion.
We can potentially see whether gold has hit its bottom by calculating the average drop from high to low over the past 50 years and applying it to the present scenario. Doing that we find:
November 1975 high of $171 to September 1976 low of $116 = 47%
November 2012 high of $1,728 to November 2015 low of $1,065 = 62%
July 2020 high of $1,971 to October 2022 low of 1,623 = 21%
January 2026 high of $5,626 to current $3,860 = 45%
The average percentage drop from high to low across these four periods is 43.7%.
De-dollarization
A huge portion of the US bond market is foreign investors including central banks who purchase sovereign US debt for their foreign exchange reserves because it is highly liquid, and they need a means of acquiring US dollars needed for the purchase of commodities and other goods and services denominated in US dollars.
When do foreign investors stop buying US Treasuries?
Some countries have slowed their purchases of US Treasuries. That includes major holders like China and Japan, and more recently Saudia Arabia, India and the UAE. Last year for the first since the mid-1990s, gold surpassed US Treasuries in central bank reserves.
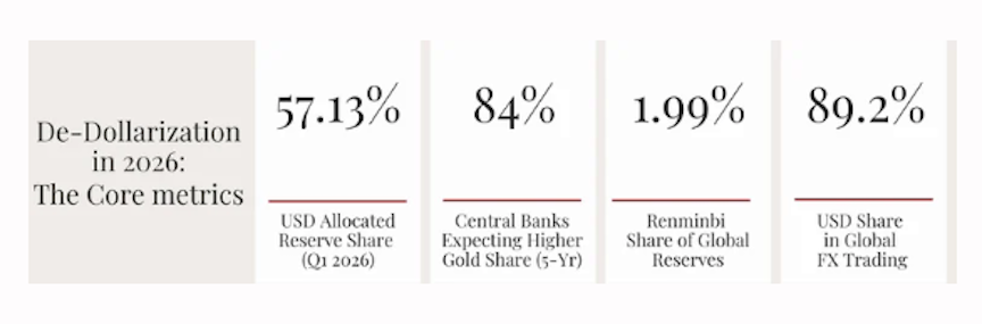
According to the Centre for Inclusive Trade Policy, the US dollar’s share of global foreign exchange reserves has fallen from 72% in 2001 to 57% in Q3 2025.
Moreover, De-dollarisation is proceeding through cumulative institutional change, not a single rupture. New token-based deposit and payment infrastructure (mBridge, Central Bank Digital Currencies (CBDCs)), bilateral swap lines, and alternative settlement corridors are being built in parallel across multiple jurisdictions.
US sovereign bond investors are concerned about servicing the massive $39 trillion debt and the growing out-of-control deficit.
Debt financing is becoming a big problem for the US government. To be clear, the Treasury prints money for the Federal Reserve to buy short-term debt.
The Fed is reportedly buying $40 billion worth of short-term Treasury bills per month.
The problem for the Fed is that maturing debt keeps rolling over, even as yields climb and the interest on this debt mounts.
According to the American Enterprise Institute, the US government is rolling over approximately $9.2 trillion of maturing debt, plus $1.7 trillion in new deficit financing, for a total of $10.9 trillion in total issuance needs.
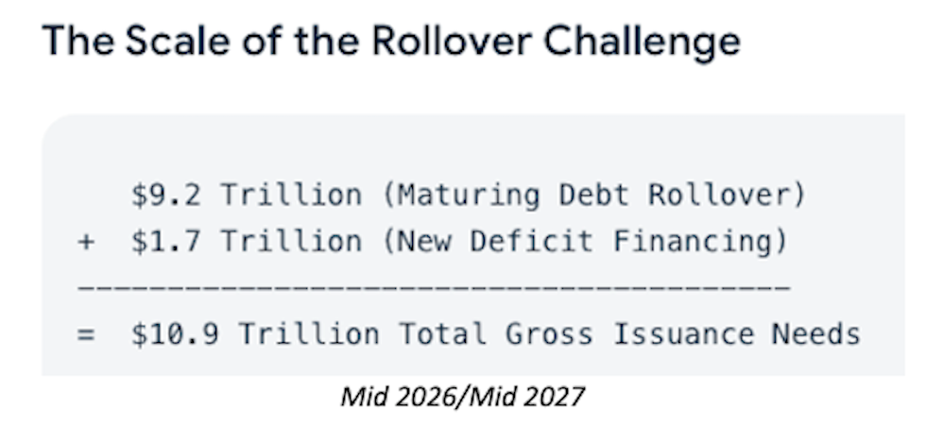
Because the US Treasury relies heavily on short-term Treasury bills, roughly 34% of all outstanding marketable US debt matures and must be refinanced within the year.
A massive wave of debt totaling up to $17 trillion through 2028 must be rolled over as older pandemic-era bills and notes expire.
The government originally borrowed much of this money at very low interest rates near 2%. Refinancing now happens in a market where 2-year yields are currently 4.8%.
As for the US federal budget deficit, it is projected to climb from $1.9 trillion in fiscal 2026 to over $3.1 trillion by 2036, driven primarily by soaring net interest payments on the national debt, mandatory and military spending.
The US has the largest nominal national debt of any country at $40 trillion. While the US debt-to-GDP ratio of 122% is smaller than Japan’s 204% and Singapore’s 172%, economists are worried about the level of the US’s debt because it restricts the levers that the Federal Reserve can pull.
US government spending is out of control and the only way for the government to pay for its spending is to print money and for the Fed to buy short-term debt. Two things are likely to happen. First, this money is eventually going to find its way into the economy and cause inflation.
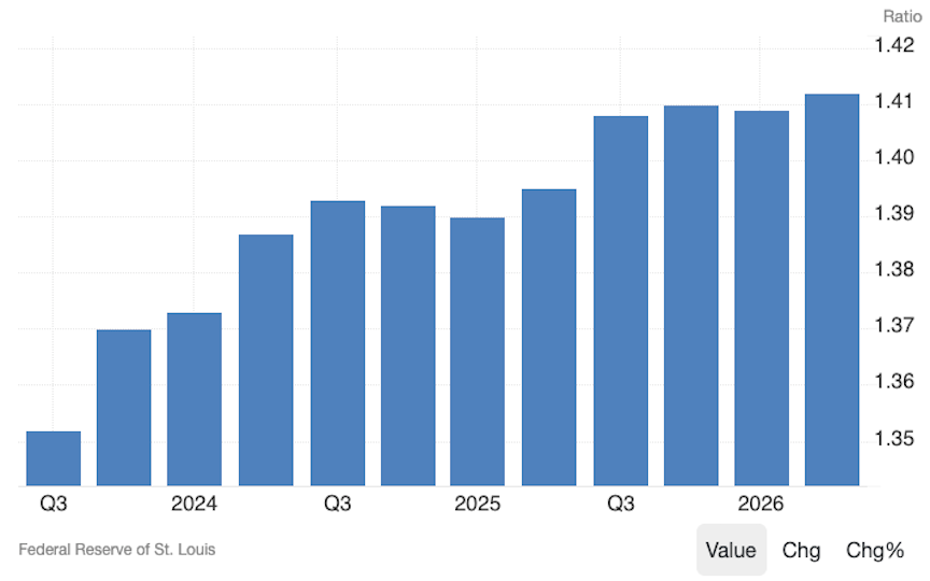
The chart below shows the velocity of money, M2V, leveling out around Q4 2025 and rising to the highest level in the period charted, in Q2 2026. Arguably, rising interest rates are making people spend cash faster than saving it.
Source: Trading Economics
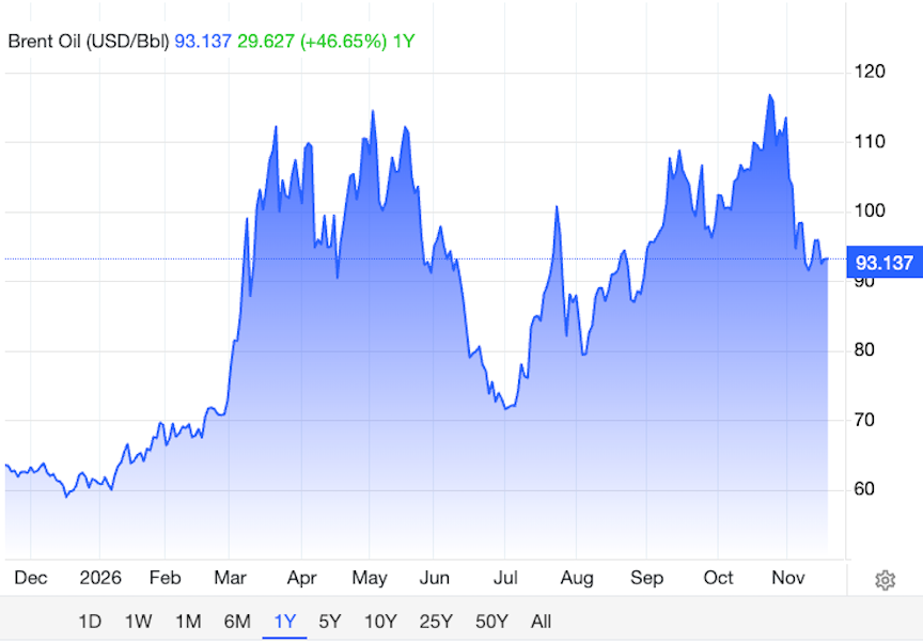
Second is that inflation will keep rising because of the war. US CPI inflation was 2.5% in February 2026, the month the war began. By May it had risen to 4.2%. The prospect of peace pulled the CPI down to 3.4% but it’s back up to 3.7%, with Brent crude oil over $93/bl.
Investors are demanding higher yields on long-term US bonds. The deficit is approaching $2 trillion. The US federal government collects about $5.23 trillion in a typical recent fiscal year. It all costs mega bucks and the only way the government can pay for it is to print money.
People are increasing worried about the US government’s ability to finance its own deficits and debt, but bond investors are also concerned about inflation destroying their yields. When this happens, arguably the game is up, and nobody will want to purchase US Treasuries.
The debasement trade
The debasement trade was coined a year ago when precious metals prices rose sharply following a dovish keynote speech at the Fed’s annual Jackson Hole symposium. It refers to the rise in the prices of gold and silver since the start of 2025 and into 2026.
The debasement trade is an investment strategy centered on buying hard assets to protect wealth from the structural decline in the purchasing power of fiat currencies.
Investors are increasingly looking past interest rates and focusing heavily on ballooning sovereign debt and fiscal deficits. With government debt at historic highs, there is a growing concern about long-term currency debasement. Investors are buying gold not as an interest-rate play, but as insurance against fiat currency devaluation.
Central banks have become some of the largest net buyers of gold, aggressively shifting their reserve assets. Following the freezing of Russia’s dollar-denominated reserves after its invasion of Ukraine,
central banks are diversifying away from US Treasuries and into physical gold to de-risk their portfolios.
When investors run with a debasement playbook, they are wagering that governments will expand the money supply and run massive fiscal deficits faster than the economy can grow. This floods the financial system with currency, making every individual dollar, euro, or yen worth less over time.
Despite the Fed’s aggressive hawkish turn, the debasement trade has remained incredibly resilient — gold futures broke back above $4,400 per ounce right after the September rate hike. This is because macro investors are looking past the Fed to a broader threat: fiscal dominance.
Total US federal government debt has topped $40 trillion. Every time the Fed raises rates, it forces the government to issue new debt at much higher yields to pay off old debt. The government’s interest bill is skyrocketing, which means the fiscal deficit expands even faster because of the Fed’s hikes.
The market knows the Fed is trapped. If it raises rates too high to kill inflation, it threatens to trigger a US Treasury market crisis or a banking system collapse. To prevent that, the Treasury Department is stepping in with bond buybacks to stabilize the system. Investors see this and realize the ultimate outcome is inevitable: the government will eventually have to print more money to keep the system solvent.
For foreign central banks, Fed tightening doesn’t change the fact that holding US debt carries geopolitical risk. They continue to accumulate physical gold as an alternative sovereign reserve asset, ignoring the Fed’s interest rate path entirely.
Central bank buying jumped to 321t in Q3, eclipsing recent typical quarterly buying levels and lifting ytd demand to 675t (+6% y/y), according to the World Gold Council’s recent report, adding that CB buying is likely to at least match 2025.
The core risk of the debasement trade is unexpected fiscal austerity or aggressive monetary tightening. If governments suddenly slash deficits, balance their budgets, and central banks successfully drain liquidity from the system to backstop the currency, hard assets will rapidly deflate because the structural threat to cash disappears. However, given global debt trajectories, most macro investors view that pivot as highly unlikely.
Conclusion
Gold had its worst October since 2008 and Monday saw the price crater to $3,830.74 an ounce, its worst showing since Oct. 2, 2025, and 31.5% below the January 2026 all-time high of $5,594.82. If the trend continues, gold is on track for its worst year since 2015.
Gold prices are falling due to the stronger US dollar, expectations that the Federal Reserve will raise interest rates again, and liquidations as investors pivot toward higher-yielding assets, like bonds.
The US 10-year Treasury yield has closed above 5% for 27 trading sessions, closing in on the 29-day record set in 2027, Bloomberg states.
But gold investors need to have some perspective.
Every time gold has climbed up a step it has hit a new high and each time it hit a low, the low was higher than the previous low. Remarkably, gold has never, in 50 years, crashed through a previous low. Every high has been higher than the last and every low has been higher than the last. This is the case even though the gold price is 45% lower than its record-high $5,594 set in January.
Ole Hansen of Saxo Bank says A deeper equity correction could eventually shift attention towards potential Federal Reserve support. Expectations for further rate hikes have already eased from three to two, with additional market stress potentially removing the remaining hikes. A weaker dollar and renewed concerns about fiscal and inflation credibility could eventually provide support for bullion.
He adds: The longer-term investment case for bullion remains intact. Rising government debt, fiscal sustainability concerns, geopolitical fragmentation and de-dollarization continue to support gold’s role as a portfolio diversifier.
Goldmoney agrees that higher bond yields create a crisis in equities which are in an extended bubble. If the Fed is to meet its inflation goal, its only option is to raise interest rates. The problem for the Fed is that higher rates and continued high consumer price inflation could push the economy into recession.
Currently the real interest rate on the 10-year is 1.4%. Bond yields need to fall significantly for gold to make sense as an investment when compared to currently high-yielding bonds. Gold has historically pulled investors from bonds when real yields approach zero or go negative.
If gold is to reclaim its record-high $5,600 by the end of 2028, the Fed will have to pivot to rate cuts:
Goldman expects four 25-basis-point cuts between November 2027 and September 2028, which would lower the Fed funds rate to 3.25%-3.5%, removing the elevated opportunity cost of holding gold and bringing rate-sensitive Western ETF investors back into the market.
Despite current price weakness, all the structural trends favoring gold remain intact.
First, de-dollarization continues to favor gold over US dollar reserves. The World Gold Council’s 2026 survey of 76 central banks found that 45% expected their own gold holdings to rise, 84% expected gold’s share of total reserves to be higher in five years, and 74% expected the dollar’s share to be lower.
Second, US government spending is out of control and the only way for the government to pay for its spending is to print money and for the Fed to buy short-term debt.
A massive wave of debt totaling up to $17 trillion through 2028 must be rolled over as older pandemic-era bills and notes expire.
The government originally borrowed much of this money at very low interest rates near 2%. Refinancing now happens in a market where 2-year yields are currently 4.8%.
As for the US federal budget deficit, it is projected to climb from $1.9 trillion in fiscal 2026 to over $3.1 trillion by 2036, driven primarily by soaring net interest payments on the national debt, mandatory and military spending.
Third, printed money is finding its way into the economy and causing inflation. The velocity of money has been steadily climbing since the first quarter of 2025. inflation will keep rising because of the war, with crude oil prices holding around $91 a barrel, as of Wednesday, Nov. 18.
Fourth, investors are focusing heavily on ballooning sovereign debt and fiscal deficits. With government debt at historic highs, there is a growing concern about long-term currency debasement. Investors are buying gold as insurance against fiat currency devaluation — a strategy known as the debasement trade.
Richard (Rick) Mills
aheadoftheherd.com

Legal Notice / Disclaimer
Ahead of the Herd newsletter, aheadoftheherd.com, hereafter known as AOTH.Please read the entire Disclaimer carefully before you use this website or read the newsletter. If you do not agree to all the AOTH/Richard Mills Disclaimer, do not access/read this website/newsletter/article, or any of its pages. By reading/using this AOTH/Richard Mills website/newsletter/article, and whether you actually read this Disclaimer, you are deemed to have accepted it.