 RSS Subscribe
A Fiscal Doom Loop causes gold to shift from trading off interest rates to trading as outside money – AOTH

One of the many negative things talked about is when do countries institutions and investors turn away from US Treasuries and what happens when the do?
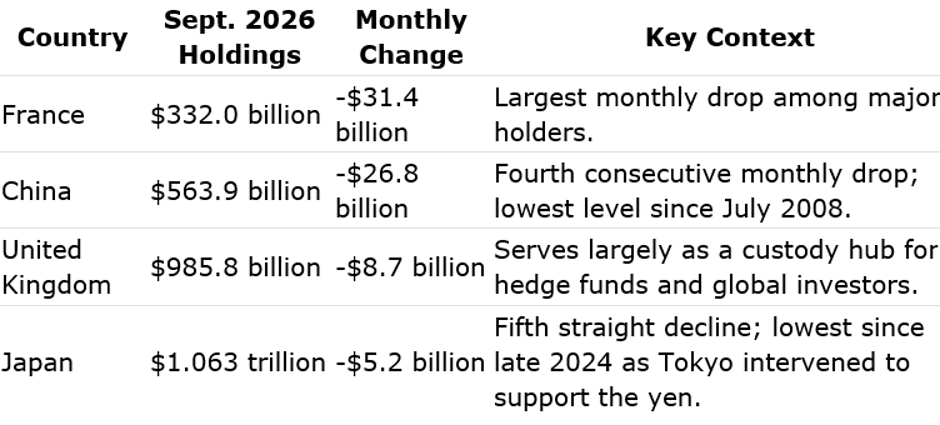
Latest figures show this is happening in China, Japan, UK, and France.
Overall foreign holdings of US Treasuries fell by US$75.5 billion to US$9.24 trillion in September, the lowest level since October 2025. This is not good news for the US in refinancing old debt and issuing new debt at over 5%.
While the September 2026 Treasury International Capital (TIC) figures show a $75.5 billion drop in total foreign holdings to $9.24 trillion, the data reflects both valuation drops from falling bond prices and shifting custodial routes rather than a uniform foreign exit.
But there is so much more to this story than that.
Breaking Down the September 2026 Data
The headline decline—the steepest monthly drop since March 2026—was led by four major nations.
Two Nuances Behind the Headline Drop
Before treating the $75.5 billion decline as pure capital flight, two accounting mechanics in the U.S. Department of the Treasury report complicate the picture.
The monthly TIC holdings total captures market value changes alongside actual buying and selling. Because the Bloomberg US Treasury index slumped 2.2% in September after the Federal Reserve hiked rates to the 3.75%–4% range, falling bond prices eroded the dollar value of existing foreign portfolios. On a pure transaction basis, foreign investors actually recorded $80.8 billion in net Treasury purchases in September.
While China’s direct holdings fell, Belgium’s holdings jumped by $17.4 billion (to $507.9 billion) and Canada’s rose by $3.1 billion (to $467.7 billion).
Market analysts widely note that Beijing routes significant Treasury transactions through European and Canadian custodial accounts, masking true sovereign ownership.
Even with transaction inflows still positive, a softer foreign bid creates clear friction for Washington as long-dated yields hover above 5% (with 30-year yields touching roughly 5.7% in October).
When price-insensitive foreign central banks step back – official institutional holdings fell $80.9 billion in September – the Treasury must rely more heavily on price-sensitive domestic buyers like pension funds, insurers, and hedge funds, who demand higher yields to absorb record supply.
Refinancing maturing low-rate debt into coupons above 5% compounds federal interest expenses, widening fiscal deficits and forcing even larger future Treasury auctions.
Higher baseline Treasury yields push up borrowing costs across the broader U.S. economy – from corporate bonds to mortgages – tightening financial conditions alongside Federal Reserve policy.
Historical parallels
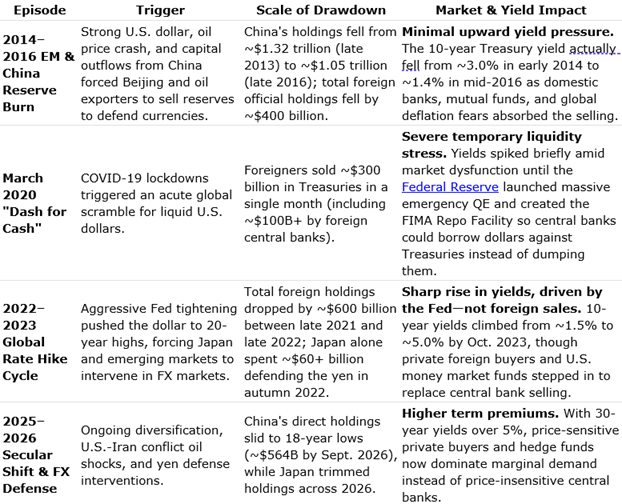
Past episodes show that major foreign central bank Treasury drawdowns have happened several times since 2014, and in every case, domestic U.S. buyers absorbed the supply without triggering a bond market collapse, though often alongside higher yield volatility.
Three Lessons From Past Drawdowns
Historically, the sharpest foreign Treasury sell-offs (2015, 2020, 2022, and 2026) occurred when foreign central banks needed liquid dollars to defend weakening local currencies—not as coordinated financial warfare.
Following the March 2020 turmoil, the Fed established the permanent Foreign and International Monetary Authorities (FIMA) Repo Facility, allowing foreign central banks to pledge Treasuries for overnight dollars rather than dumping bonds onto the open market.
Over the past decade, foreign official ownership has dropped from over 50% of the market (2008) to roughly 30%. Past drawdowns show the market clears without a crisis, provided yields rise high enough to attract domestic households, pension funds, money market funds, and leveraged hedge funds
Across modern episodes of foreign central bank selling, U.S. Treasury yields had to climb to roughly 3.0% during the 2013–2016 drawdown, 5.0% in October 2023, and 5.31% (10-year) to 5.67% (30-year) in October 2026 before private and domestic buyers stepped in aggressively enough to cap the sell-off.
There is no single magic interest rate that clears the market; instead, the “clearing yield” depends on inflation expectations, the Federal Reserve’s policy rate, and which type of domestic buyer is absorbing the supply.
Clearing Yield Peaks Across Major Drawdowns
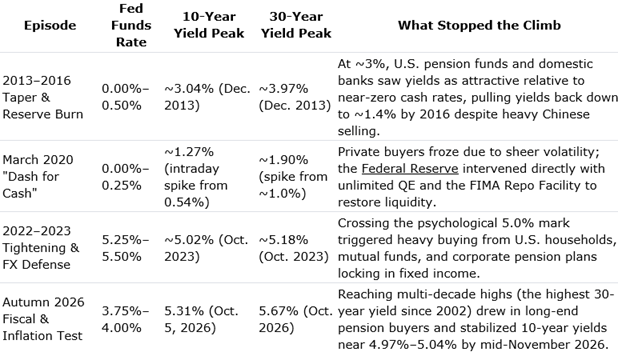
What Yield Level Triggers Each Buyer Group?
Because private buyers are price-sensitive, each group steps in at a different threshold along the yield curve:
- Money Market Funds (Short-Term T-Bills).They do not wait for a specific yield number; they buy whenever short-term Treasury bills (currently yielding 4.1%–4.5%) pay slightly more than the Fed’s overnight reverse repo rate.
- Leveraged Hedge Funds (Basis Traders). Hedge funds—which hold roughly 8% of marketable Treasuries via repo-financed arbitrage—step in regardless of the outright yield level, provided there is a pricing gap between cash Treasuries and Treasury futures.
- Domestic Households & Wealth Managers. Retail buyers historically surge into Treasury auctions and bond funds when nominal yields cross clean psychological milestones—such as 3% in 2013 and 5%+ in 2023 and 2026—especially when yields comfortably beat inflation.
- Pension Funds & Insurers (Long-End 20Y–30Y Bonds). Corporate pensions look at real (inflation-adjusted) yields and funded ratios. When 30-year nominal yields pushed past 5.5% (and 30-year TIPS real yields topped 3.2%), pensions rotated out of equities to lock in guaranteed long-term liabilities
When hedge funds get caught in a repo spike, forced liquidations trigger a rapid sell-off in cash Treasuries that spikes yields and freezes market liquidity—a dynamic the Federal Reserve monitors closely because hedge fund basis trades exceed $1.2 trillion (with gross hedge fund Treasury exposures near $4 trillion).
For the U.S. government to actually run out of buyers and be forced to “print money” to cover its debt, the crisis would have to move from a temporary liquidity freeze (which happened in March 2020) to a permanent loss of fiscal solvency or currency confidence.
Part 1: What Happens When Repo Costs Spike & Hedge Funds Unwind
Hedge funds run the basis trade by buying cash Treasuries (using massive leverage—often 15x to 20x—borrowed overnight in the repo market) and simultaneously shorting Treasury futures to capture tiny price gaps. Because the profit margins are razor-thin, a spike in overnight repo rates or a jump in futures margin requirements turns a profitable trade into an immediate cash drain.
To stop bleeding cash, hedge funds must dump their cash Treasuries and buy back their short futures simultaneously. Because the largest 50 funds control roughly 90% of this activity, they tend to rush for the exit at the exact same time.
Normally, big Wall Street banks (primary dealers) buy bonds when everyone else sells. However, during a sudden unwind, dealers’ balance sheets fill up rapidly, causing them to step back, widen bid-ask spreads, and stop making markets.
Without dealers to absorb the flood of selling, Treasury prices plunge and yields spike violently—immediately driving up mortgage rates, corporate borrowing costs, and margin calls across global stock and credit markets.
Before the Treasury market breaks completely, the Federal Reserve has two built-in backstops designed to stop a repo-driven doom loop:
- The Standing Repo Facility (SRF): Allows primary dealers and banks to pledge Treasuries directly to the Fed for overnight cash at a capped rate, preventing repo borrowing costs from spiraling out of control.
- Targeted Liquidity Purchases: As seen in March 2020, the Fed can temporarily buy cash Treasuries to clear dealer balance sheets—acting as a “market maker of last resort” rather than permanently monetizing the debt.
Part 2: What Would Have to Happen for Buyers to Stop Buying Completely?
In a modern fiat currency system where debt is denominated in U.S. dollars, private buyers almost never “stop buying” entirely—they simply demand a higher yield until the price is cheap enough to compensate for the risk.
For private demand to dry up to the point where the Federal Reserve is forced to permanently print money (debt monetization / yield curve control) to fund the government, three extreme conditions would have to align simultaneously:
- Federal deficits would need to grow so large that higher interest rates actually worsen U.S. creditworthiness rather than attracting buyers. Specifically, if investors believe the government can only pay interest on old debt by issuing exponentially more new debt—with zero political path to spending cuts or tax hikes—higher yields stop attracting capital and instead signal default or debasement risk.
- Buyers only step in at 5% or 6% yields if they believe inflation will eventually settle around 2%–3%. If inflation permanently re-accelerates to 6%–8%+ while the Fed refuses to raise rates high enough to beat it, buyers suffer guaranteed losses in purchasing power and abandon long-term bonds for hard assets (gold, commodities, real estate, equities).
- Domestic banks, pension funds, insurers, and money market funds hold trillions in Treasuries largely because financial regulations treat them as risk-free collateral. For domestic buying to vanish, regulators would have to strip Treasuries of their zero-risk weighting, or U.S. savings pools would have to shrink dramatically relative to government borrowing needs.
Even in a severe fiscal crisis, the U.S. government would not technically fail to sell bonds at auction. Instead, the Federal Reserve would be forced into “Fiscal Dominance.”
To prevent the U.S. government from defaulting on interest payments or crashing the banking system, the Fed would cap Treasury yields (e.g., declaring it will buy unlimited 10-year bonds at 5.5%).
Because the Fed creates new bank reserves (“prints money”) to buy those bonds, the pressure shifts entirely from the bond market to the U.S. dollar and inflation. Bond yields stay artificially capped, while the dollar weakens sharply and consumer inflation surges—effectively taxing bondholders through currency debasement rather than outright default.
Fiscal “doom loop”
The U.S. is currently sitting in the early stages of a fiscal “doom loop”, where rising interest costs are actively compounding the deficit—though economists emphasize it is currently a slow-burn arithmetic squeeze rather than an immediate bond market collapse.
Data from the end of Fiscal Year 2026 (September 30, 2026) shows why bond investors and budget watchdogs are sounding the alarm.
U.S. net interest payments hit a record $1.05 trillion in FY 2026 (up 11% from FY 2025), surpassing the entire $956 billion national defense budget for the first time.
The total FY 2026 federal deficit reached $1.99 trillion (6.2% of GDP). Because net interest makes up more than half of that shortfall, Washington is effectively issuing new debt just to cover interest payments on existing debt.
The weighted average interest rate on all U.S. debt climbed to 3.53% in late 2026 (more than double the 1.6% rate in 2021). Every time old 1%–2% bonds mature and roll over at 5%+ yields, annual interest expenses ratchet higher automatically.
The Tipping Point: The “r > g” Trap
In economics, a true, self-reinforcing debt spiral occurs when the average interest rate on government debt (r) exceeds the nominal growth rate of the economy (g) while the government still runs a primary deficit (spending more on programs than it collects in taxes).
In 2026, U.S. nominal GDP growth (roughly 2.2% real growth plus ~3% inflation, or ~5%–5.5% nominal) is still slightly above the 3.53% average interest rate paid on total existing debt. That growth helps keep the debt-to-GDP ratio near 100% from exploding overnight.
According to Committee for a Responsible Federal Budget (CRFB) projections, if 10-year and 30-year yields stay near or above 5%, the U.S. average borrowing rate (r) will surpass economic growth (g) around 2029. Once r > g, debt grows faster than the economy even if Congress balances the rest of the budget, pushing public debt toward 125%–222% of GDP over the coming decades.
Dumpster fire economics, consumers red-lined
Despite the alarming math, the U.S. has not hit a sudden “Greece-style” cutoff for three reasons:
- Global trade, energy markets, and banking collateral still run on U.S. dollars, creating structural baseline demand that smaller nations lack.
- U.S. households, money market funds, pensions, and banks hold tens of trillions in assets and continue absorbing auctions whenever yields cross ~5%.
- Because the Treasury spreads maturities across 2- to 30-year notes, a 5.5% yield today only affects the slice of debt maturing this year—not all $40 trillion at once.
What turns a slow-burn loop into a sudden crisis is an external shock—such as a severe recession (which collapses tax revenues while forcing emergency spending) or a sustained oil/inflation surge (like the 2026 Middle East conflict shock) that keeps yields pinned near 6% while growth stalls. At that point, Congress faces an unavoidable choice between painful tax hikes/spending cuts, financial repression (forcing banks and pensions to hold Treasuries), or Federal Reserve money printing to cap yields.
Conclusion
According to the Congressional Budget Office (CBO), the FY 2026 federal deficit reached $2.0 trillion ($140 billion wider than projected earlier in the year), pushing publicly held debt to roughly 101% of GDP. With net interest exceeding $1 trillion (surpassing annual defense spending), borrowing to pay interest is already underway.
As long-term yields climbed above 5% in 2026, Treasury Secretary Scott Bessent publicly called for lower interest rates and accelerated U.S. Department of the Treasury buybacks of long-dated securities. While short of formal yield curve control, analysts at Thornburg Investment Management note it signals growing sensitivity to long-term borrowing costs.
Critics warn that if Federal Reserve Chair Kevin Warsh—who has emphasized central bank independence—were ever pressured into capping yields while inflation remains sticky above 2%, money creation would likely weaken the U.S. dollar and stoke higher consumer prices.
If the Federal Reserve refuses to implement yield curve control while Congress continues running large deficits without spending cuts or tax hikes, the bond market takes over as the primary enforcer of fiscal discipline—forcing long-term yields sharply higher until rising borrowing costs trigger a recession or a financial market break.
Historically, a standoff where the Fed refuses to monetize debt and Congress refuses to cut deficits cannot last indefinitely. It resolves in one of three ways:
- Facing plunging stock markets, soaring mortgage rates, or a credit rating downgrade, lawmakers are forced into emergency deficit reduction—either via spending caps, entitlement adjustments, or tax increases—to calm bond investors (similar to the 1990s deficit deals).
- If soaring yields threaten the solvency of major U.S. banks or freeze the Treasury repo market (like March 2020), the Fed is forced to intervene as “lender of last resort”—effectively capitulating into stealth yield curve control or emergency bond buying to prevent systemic collapse, even if it means accepting higher inflation.
- Regulators alter banking and retirement rules (such as loosening leverage ratios or mandating higher sovereign holdings) to force domestic banks, money market funds, and pensions to absorb excess Treasury supply without requiring explicit Fed money printing.
Over the long run, a fiscal “doom loop” is historically bullish for precious metals—especially gold—because it forces an eventual choice between currency debasement and sovereign credit stress, though in the short term, hawkish Federal Reserve resistance and surging real yields can trigger sharp pullbacks.
Because the Federal Reserve is resisting yield curve control and signaling potential rate hikes to fight sticky inflation, rising real Treasury yields and a stronger U.S. dollar have pushed gold down from its earlier 2026 record highs (above $5,500/oz) to roughly $3,525–$3,585/oz in mid-November 2026, while silver has pulled back to roughly $41–$42/oz.
Analysts at Sprott and the World Gold Council emphasize that once bond yields rise because of fiscal stress rather than economic strength, gold shifts from trading off interest rates to trading as “outside money” with zero counterparty or sovereign default risk.

Legal Notice / Disclaimer
Ahead of the Herd newsletter, aheadoftheherd.com, hereafter known as AOTH.Please read the entire Disclaimer carefully before you use this website or read the newsletter. If you do not agree to all the AOTH/Richard Mills Disclaimer, do not access/read this website/newsletter/article, or any of its pages. By reading/using this AOTH/Richard Mills website/newsletter/article, and whether you actually read this Disclaimer, you are deemed to have accepted it.