 RSS Subscribe
The law of the physical squeeze – AOTH

The FTSE/CoreCommodity CRB Total Return Index is up 41.98% Year-to-Date (YTD) and 41.10% Year-over-Year (YoY) as of late October 2026.
The performance of the core CRB index variations breakdown as follows:
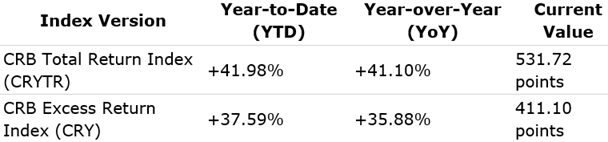
The index reached a historic all-time high of 552.20 points in September 2026.
The performance of the CRB Index in 2026 is marked by a massive divergence between its individual sectors. While the headline index has posted impressive gains, a dramatic sector rotation has completely flipped the performance rankings of the previous year.
The energy complex, 39% of the Index, has done almost all of the heavy lifting for the broader CRB index this year.
- Performance: Surged nearly 100% Year-to-Date.
- Key Drivers: Extreme price increases in Brent and WTI crude oil, U.S. diesel, and heating oil. War-related supply disruptions (particularly involving major geopolitical friction in the Middle East) alongside historically tight refined-product inventories and deferred refinery maintenance have kept supply heavily constrained.
The agricultural and soft commodity sector, 41% of the Index, has experienced highly volatile, fractured performance.
- Performance: Moderately Positive Overall (highly dependent on the specific crop).
- Key Drivers: Extreme weather disruptions (such as intense heat waves and an active El Niño) gave the sector its strongest single-month return in over a decade earlier in the autumn. Soft commodities like cocoa, coffee, and sugar have seen intense upward pressure from tight physical supplies. However, this has been partially offset by downward pressure and losses in traditional grains (like corn and wheat) where global logistics normalized.
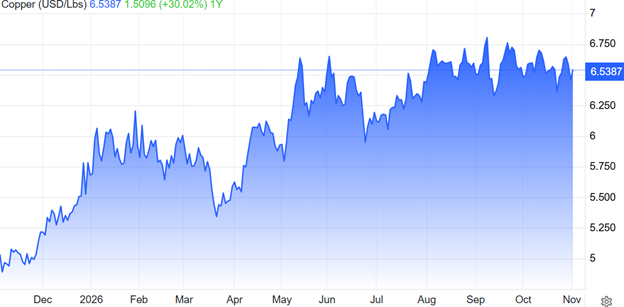
Industrial metals, 13% of the Index, have closely mirrored the broader macroeconomic environment, trading relatively flatly compared to the wild moves in energy.
- Performance: Slightly Positive / Near Flat YTD.
- Key Drivers: Copper and aluminum remain resilient and supported by the global transition toward electrification, clean energy infrastructure, and strong demand for EV manufacturing. However, global economic slowdown anxieties and manufacturing contraction in the automotive sectors have capped any runaway rallies.
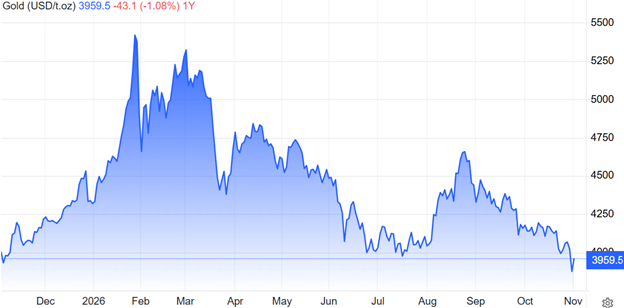
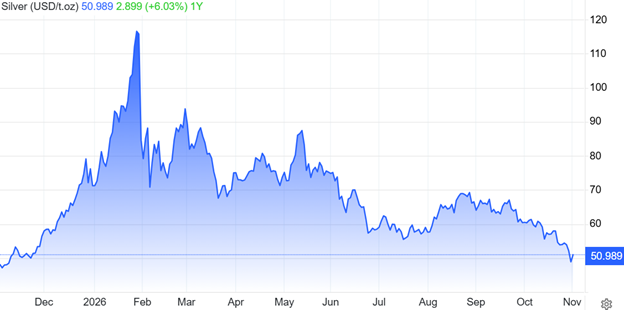
In a complete reversal from last year, precious metals, 7% of the Index, have given back a portion of their previous gains.
- Performance: Down roughly 11% Year-to-Date.
- Key Drivers: After hitting spectacular record highs in 2025 (surging ~80%), gold and silver faced aggressive profit-taking and a sharp cyclical reversal in 2026. While central bank buying has provided a structural floor for gold, speculative positioning unwound as high interest rates and volatile global bond yields drew capital away from non-yielding metals.
A strong U.S. dollar and surging commodity prices are fundamentally at odds, making the 2026 market layout a massive macroeconomic anomaly.
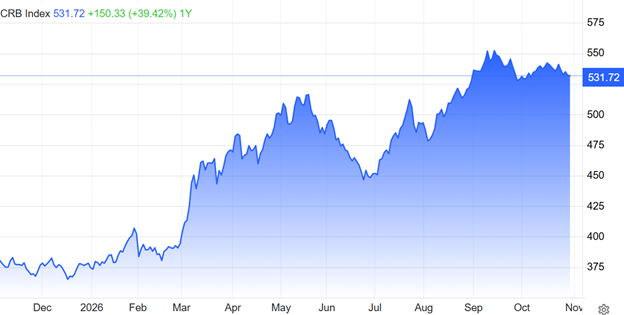
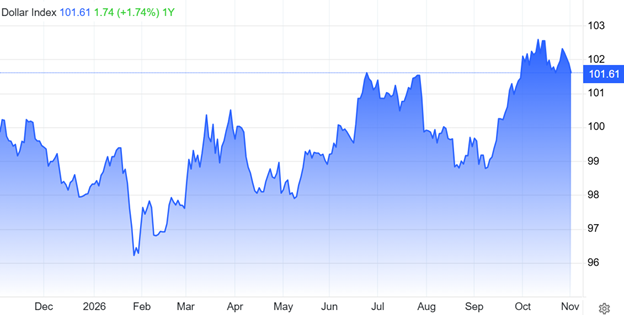
Historically, these two have a reliable inverse relationship (a negative correlation). When the dollar rises, commodities (which are globally priced in USD) become more expensive for foreign buyers using weaker currencies, which naturally destroys international demand and forces commodity prices down.
However, 2026 has completely broken the traditional “seesaw” playbook. The simultaneous rise of both the U.S. Dollar Index (DXY) and the CRB Index is driven by three powerful factors that are overriding currency mechanics.
Pure Supply Tightness Tramples Currency Micro-Effects
The primary rule of commodities is that physical supply and demand will always beat macro currency trends. If there isn’t enough physical inventory of a critical resource, buyers will pay whatever it takes, regardless of how strong the dollar is.
- The Energy War Premium: The intense war-related supply shocks in the Middle East have severely depleted global oil stocks, forcing a steep drop in oil supply.
- Weather and Logistics: Severe climate anomalies (like the compounding El Niño effects) and transport constraints in Europe and the Black Sea have triggered extreme global deficits in soft agricultural commodities.
The Structural Shift: The U.S. as a Net Oil Exporter
The Bank for International Settlements (BIS) highlighted a profound, structural change in global markets: the U.S. is no longer a net oil importer; it is a massive net exporter.
- Old Regime: Higher oil prices used to drain money out of the U.S. economy, weakening the dollar.
- New Regime: Because the U.S. now exports massive amounts of crude oil and LNG, skyrocketing energy prices directly improve America’s “terms of trade”. A spike in commodity prices now actively pushes capital into the U.S., driving up the dollar alongside the commodities themselves.
A Shared Catalyst: Higher-for-Longer Inflation
Both assets are reacting to the exact same underlying catalyst this year: sticky inflation.
- Rising raw material prices are driving global inflation.
- In response, the Federal Reserve has had to maintain high interest rates and signal a more hawkish stance than other central banks.
- These high yields are drawing massive global capital into U.S. Treasuries, artificially pumping up the value of the dollar.
Ultimately, the market is trapped in a feedback loop. High commodity prices are causing stickier inflation, which leads to higher interest rates, which yields a stronger dollar.
Rising raw material prices are driving global inflation
The World Bank officially confirmed this macro shift, reporting that global commodity prices are surging 23% overall in 2026, stalling the global disinflation trend. After trending downward since 2024, the International Monetary Fund (IMF) revised its global inflation projections upward to 4.7% for 2026 specifically due to these raw material shocks.
The transmission mechanism of this commodity-driven inflation is moving through global production pipelines in three distinct phases:
The “First Wave”: Core Energy and Transport Costs
The initial impact of rising raw material prices hits the production chain instantly via fuel and power.
- Energy Surge: Driven heavily by the ongoing Middle East conflict and depleted global inventories, global energy prices are projected to rise 32% this year.
- Pipeline Pressure: This has directly manifested in wholesale data; for instance, wholesale price indexes show energy and petroleum products surging dramatically month-over-month, which dramatically drives up the baseline cost of moving freight and operating factories globally.
The “Second Wave”: Intermediate Goods Processing
Once energy spikes, it creates a lagging, compounding effect on intermediate goods—the raw materials that must be chemically altered or manufactured into parts before reaching consumers.
- Price pressures in intermediate goods pipelines have reached 9.5% in the U.S., 8.2% in the U.K., and 6.5% in the Eurozone.
- Fertilizer prices are up 14% due to surges in chemical feedstock costs (like urea), creating a direct, unavoidable cost increase for the agricultural sector.
Fertilizer shortages to continue, even as oil flows resume
The “Third Wave”: Consumer Staples Shock
Because global corporate profit margins cannot fully absorb a 23% macro commodity spike, businesses are actively passing these input costs directly onto the consumer.
- Food Inflation: A severe combination of grain shipping disruptions and the compounding effects of an extreme El Niño weather pattern is pushing global food commodity prices up 10% this year, with an additional 7% expected next year.
- Core CPI Squeeze: The Bank of Canada’s updated econometric projection models (PRIMA) note that while direct energy impacts show up in headline consumer metrics immediately, these secondary and tertiary pass-through effects on non-energy consumer items move slowly and are expected to artificially keep inflation sticky well into 2027 and 2028.
The ultimate result is a monetary policy trap: central banks are forced to remain hawkish and hold interest rates “higher for longer” to fight cost-push inflation, even though monetary policy cannot magically produce more oil, cocoa, or copper.
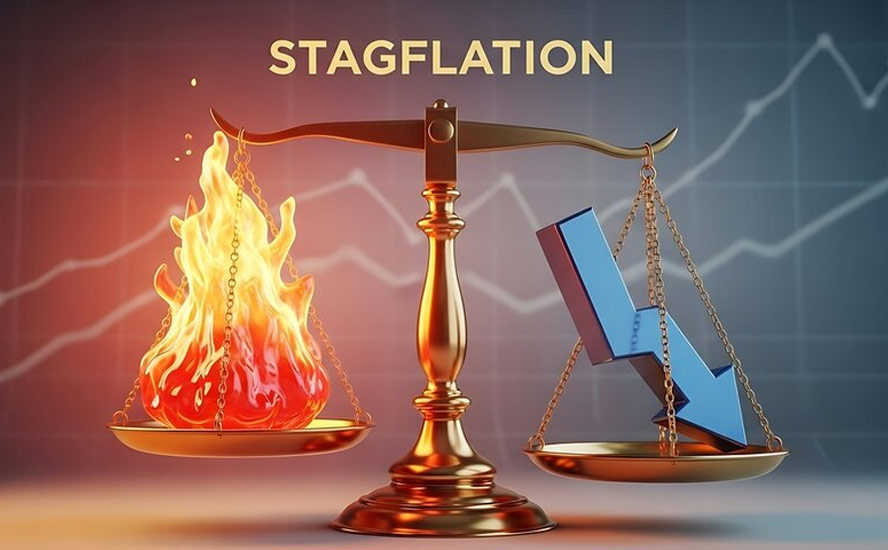
The risk of global stagflation in 2026 is at its most pronounced level in over 40 years. The Bank for International Settlements (BIS) notes that while a strong dollar or high commodities are tough on their own, their rare simultaneous surge acts as a double-hit on global growth while severely accelerating inflation.
The International Monetary Fund (IMF) has highlighted a deeply “split” global economic outlook. They downgraded global growth projections while shifting global inflation expectations upward to 4.7% for 2026. This scenario represents a classic “stagflation-lite” or localized stagflation trap, driven by three major macro pressures:
The Cost-Push Squeeze on Commodity Importers
Agricultural train wreck and the 2027 global food crisis
For nations that rely on importing energy and food, the current environment is a worst-case scenario.
- The FX Penalty: Because commodities are priced in U.S. dollars, non-U.S. economies face a double penalty: they must pay vastly higher prices for raw materials, and they must do so using weakened local currencies.
- Industrial Drag: Major industrial, energy-dependent advanced economies—most notably Germany, Italy, the U.K., and Japan—face stalling economic growth. The European Central Bank (ECB) has explicitly warned that prolonged energy shocks threaten to tip parts of the Eurozone into a technical recession by the end of 2026.
Central Banks are Completely Trapped
During a standard economic slowdown, central banks cut interest rates to stimulate growth. Stagflation breaks this playbook:
- If central banks cut rates to save a slowing economy, they risk feeding the inflation fire fueled by supply shocks.
- Consequently, the Federal Reserve, ECB, and Bank of England are being forced to keep interest rates “higher for longer” to anchor inflation expectations.
- These high borrowing costs crush consumer credit and business investment, intentionally slowing down economic growth to fight inflation they cannot control directly via monetary policy.
The Structural Cushion: The “Split” Economy
Why hasn’t the global economy fully collapsed into 1970s-style systemic stagflation? The shock is hitting unevenly:
- The Tech/AI Buffer: Advanced economies heavily integrated into the AI and technology hardware supply chains (like the U.S., Taiwan, and South Korea) are experiencing massive investment booms that are keeping aggregate GDP growth afloat.
- Commodity Exporters Win: Emerging markets that actively produce and export raw materials are benefiting from massive windfalls, insulating them from the broader slowdown.
The ultimate risk is that the buffer provided by tech investments begins to fade before energy prices cool off, which would cause broader manufacturing and employment sectors to weaken and firmly cement global stagflation
Conclusion
Precious and industrial metals suffered a historic multi-day plunge late last week (with gold hitting multi-month lows and silver dropping sharply) driven by forced liquidations and margin calls across broader markets.
Gold, silver, and copper are up today partly as a direct relief reaction to falling oil prices, which help ease persistent inflation fears and central bank rate pressures, alongside a broader technical bounce and stabilization after heavy late-October liquidations.
This morning’s action reflects a technical rebound and bargain-hunting after extreme downside volatility.
Copper is moving higher alongside precious metals as the relief in energy costs temporarily calms recession and stagflation worries that had previously triggered a synchronized sell-off across industrial commodities.
Copper Needs $332 Billion in New Mines to Avoid Deficit, BloombergNEF Says
The primary rule of commodities, ‘The law of the physical squeeze’, means when a real-world shortage hits a vital resource, the financial paper market eventually breaks, and physical demand absolutely vaporizes macro currency trends. Physical supply and demand will always beat macro currency trends. If there isn’t enough physical inventory of a critical resource, buyers will pay whatever it takes, regardless of how strong the dollar is.
While macro factors like a strong U.S. Dollar or shifting Federal Reserve policies can suppress prices on paper, physical scarcity forces structural “inelastic” buying—where industrial entities must pay any premium simply to keep their factories running.
This exact dynamic creates a clear divide between how different metals behave:
Copper: The Ultimate Example of Your Rule
Macro sentiment (like recession fears or a surging dollar) often hammers copper on paper. However, as noted by Morgan Stanley analysts, visible global copper inventories are severely depleted outside of the United States, and Chinese physical premiums remain incredibly high due to smelter maintenance and raw scrap shortages.
Because copper is non-substitutable for global electrification, green infrastructure, and data centres, buyers are forced to absorb these costs.
Physical tight supply creates a hard floor that macro currency trends cannot break.
Silver: The Dual Identity
Silver sits right on the fence. Half of its demand is macro/monetary (acting like gold), and the other half is strictly industrial (solar panels, electronics, automotive). When macro forces cause massive paper liquidations (like the heavy sell-off we saw over the last month), silver gets hammered. But because industrial silver inventories have been in a structural deficit for consecutive years, physical buyers step in during deep price drops, using the physical crunch to overpower the paper-market short sellers.
Gold: The Exception to the Rule
Gold is the one asset where this rule partially flips. Gold is rarely consumed industrially; almost all gold ever mined still exists in vaults. Therefore, gold does not experience “physical depletion” squeezes in the same way copper or oil do. Gold is driven almost entirely by institutional fund flows, central bank accumulation, real interest rates, and macro currency trends.
For critical industrial inputs physical reality always wins the tug-of-war in the end.
“When a critical input becomes scarce, producers seek substitutes, inventories are drawn down and existing capacity is pushed harder. These adjustments can be remarkably effective. They buy time. But time is ultimately what inventories represent. Every barrel released from a reserve, every tonne withdrawn from a warehouse, and every industrial workaround implemented today simply postpones the moment when supply and demand must once again be reconciled.” Commodity Markets Are Living on Borrowed Time

Legal Notice / Disclaimer
Ahead of the Herd newsletter, aheadoftheherd.com, hereafter known as AOTH.Please read the entire Disclaimer carefully before you use this website or read the newsletter. If you do not agree to all the AOTH/Richard Mills Disclaimer, do not access/read this website/newsletter/article, or any of its pages. By reading/using this AOTH/Richard Mills website/newsletter/article, and whether you actually read this Disclaimer, you are deemed to have accepted it.