 RSS Subscribe
Copper and silver physical tightness reigns supreme – Richard Mills
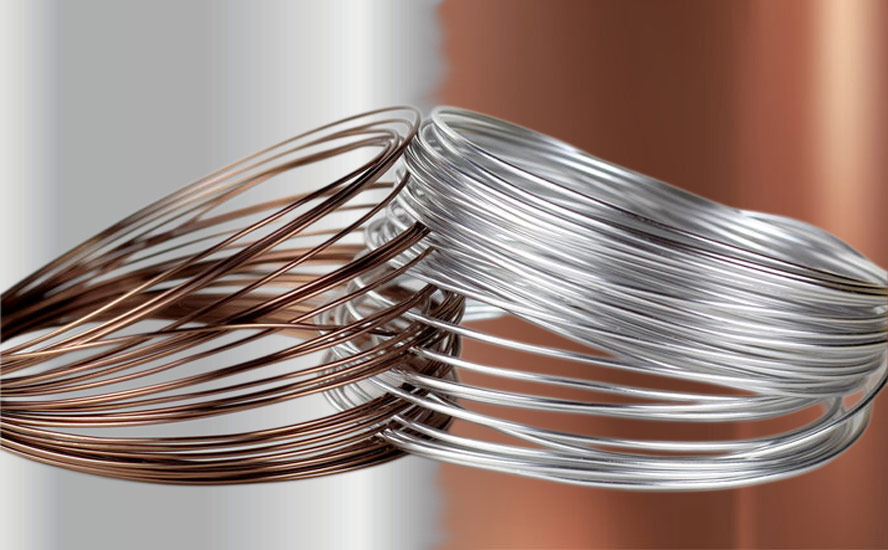
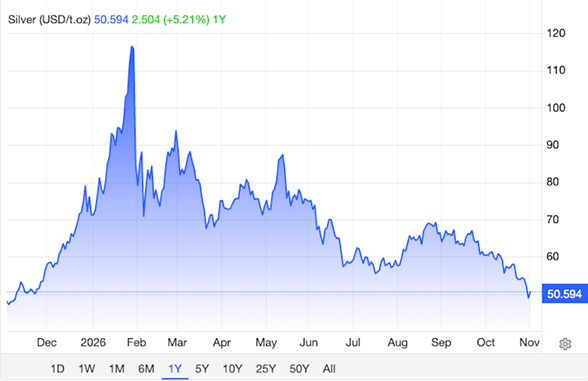
Silver hit a record high in January, topping out at $121.67/oz.
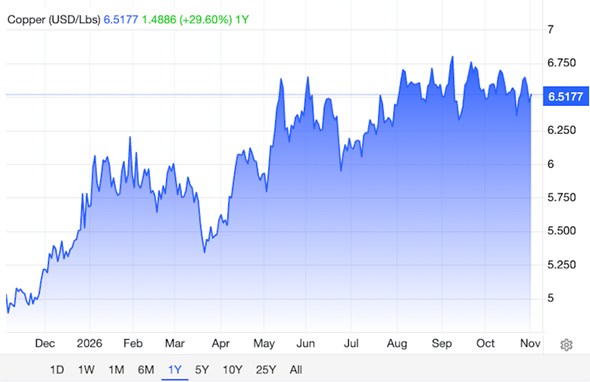
Copper also climbed to a January 2026 pinnacle, briefly exceeding $6.57 per pound. The base metal on Sept. 10 reached a fresh record of $6.74.
While both metals have since pulled back, their price trajectories are bullish.
Copper and silver bounce
Copper snapped a three-month winning streak on Friday, Oct. 30, due to investor concerns that spending on artificial intelligence may not generate sufficient returns.
Reuters reported the red metal was set to post a 1.8% decline in October, “as higher oil prices and a slump in tech shares prompted a flight to bonds.”
Still, the publication noted the copper market is tight after months of shipments into US warehouses have reduced availability in traditional consuming hubs.
“Backwardation in copper remains elevated, pointing to persistent near-term tightness,” said Neil Welsh, head of metals at broker Britannia Global Markets.
Metals prices are highly influenced by the price of crude oil.
Crude is essential for global transportation and manufacturing. When oil prices rise, shipping, trucking, and factory energy expenses increase, pushing up production costs and final prices for goods like food, metals and plastics.
Gold, silver and copper all pushed higher on Monday as oil prices declined over 6% due to renewed talks on resolving the Iran war.
This sudden drop in oil has softened inflation concerns, reducing expectations for aggressive Federal Reserve rate hikes. This relief has cleared a path for precious metals to rebound. Because gold and silver do not yield interest, high-rate environments damage their appeal.
Moreover, because metals are priced in greenbacks, a weaker dollar makes gold, silver and copper cheaper for overseas buyers using other currencies, boosting demand and pushing prices up.
Major silver consumer India is helping prop up silver prices by allowing more of the metal into the country on the eve of Diwali.
Heraeus analysts wrote that India is relaxing its silver import regime, which will likely boost silver consumption over the next two quarters.
“India has issued permits for around 6,500 tonnes of silver imports over the next six months, potentially removing a major constraint on physical inflows,” they said. “The allocation is equivalent to approximately 209 moz, around 90% of the 232 moz India imported during the whole of 2025 (source: The Silver Institute)…
They noted that the timing of these moves is significant, as demand usually rises through the festival season heading into Diwali, which is on November 8.
While gold and silver are reacting heavily to oil, copper has an added industrial driver. Momentum for copper is being supported by a tightening of global supply, specifically due to a reduction in Chile’s production forecasts alongside elevated import premiums in China.
China: Record premiums and a border backlog
Indeed, copper import premiums into China such as the Yangshan copper premium have climbed to record highs exceeding $200 a ton.
One reason for the high China premiums is a drop in copper imports.
Associated Press reported last week that the operator of Mongolia’s massive copper-gold-silver mine — Oyu Tolgoi — has lessened its export of copper concentrate to China by about 70% in the past two weeks due to border restrictions.
Specifically, the number of truck convoys moving concentrate across the Chinese border has fallen from the usual 12-13 to just four.
The slowdown relates to a truck driver facial recognition system introduced by Chinese authorities in August. The new system, which has affected border processing capacity, was supposed to be completed by late September but may continue until the end of December.
Meanwhile, copper supplies in China are tightening.
BMO researchers pointed to record contract settlements for cathode premiums alongside the surge in Yangshan prices, suggesting buyers are paying increasingly high premiums to secure available material even as speculative investors remain cautious.
Supply risks are also emerging in Africa. BMI, a unit of Fitch Solutions, has warned that the Democratic Republic of Congo (DRC) and Zambia could face electricity shortages stemming from El Niño-induced drought, potentially disrupting copper production in two major producing countries.
The DRC is also tightening oversight of artisanal mining. (Mining.com)
Chile’s production woes
In Chile, supply constraints continue to dog the world’s biggest copper producer, with output falling 15% year on year in September — and sinking to its lowest quarterly level in at least two decades in the three months through September.
According to Bloomberg, State copper commission Cochilco cut its 2027 production forecast to 5.08 million metric tons, implying a 3% rebound. It also slashed this year’s estimate to 4.94 million tons from 5.27 million amid accidents and wild weather, representing an 8.4% annual drop.
Some of Chile’s biggest copper operations have failed to meet targets. Cochilco reports that mines run by Codelco and BHP account for 77% of the net decline. The state copper commission blames lower ore grades, maintenance and interruptions that have hurt processing and copper recoveries.
The “copper” lining is higher prices. Cochilco raised its forecasts from $5.95 a pound to $6.18 for 2026, and from $5.10 in 2027 to $5.95.
Hoarding
Several countries have designated copper as a critical mineral to support their economies, defense needs and clean energy transitions.
Copper’s criticality is causing governments to stockpile it to prevent shortages. According to Jose Torres, chief economist at Interactive Brokers, copper’s global strategic importance means prices will remain elevated.
“Broadly, it has to do with limited supply as nations want to stockpile the cyclical metal to bolster sovereign AI prospects,” he told Business Insider. “Governments are afraid that without enough copper, their economies won’t remain competitive in a world where advanced technology is increasingly adopted.”
Global mined copper output is set to fall in 2026 for the first time since 2017. Key supply constraints include declining ore grades, mine disruptions, and slow project pipelines.
Demand drivers include AI data centers, which rely heavily on copper for electrical conductivity, power distribution and heat management; the energy transition characterized by the rapid adoption of electric vehicles and renewable energy grid expansions requiring intensive copper deployment; and global defense spending adding further pressure to raw material supply chains.
While the copper market was roughly balanced in 2025, meaning that refined production met consumption, mine supply was severely disrupted and will likely create a deficit in 2026, states the International Institute for Strategic Studies (IISS).
The global copper market is approaching a key inflection point as disruptions to mine supply, a lack of major discoveries and rising demand point to the market’s first structural shortage since 2009.
Copper production to decrease for first time in 9 years — Richard Mills
According to S&P Global, without new mines or technological advancements, copper production will peak in 2030. A “substantial shortfall” of up to 10 million metric tons is projected by 2040 as demand surges 50% to 42 million tonnes.
A total of $332 billion of investment is needed in new copper mines to avoid a looming copper deficit that could slow electrification, BloombergNEF said in its Transition Metals Outlook 2026 on Oct. 20, via Oilprice.com.
US copper stockpiles conceal global supply crunch
The uncertainty surrounding expected US imports on refined copper — now delayed due to concerns over affordability after a June 30 deadline passed — is “pulling metal inventories into the US without requiring large-scale government purchases.”
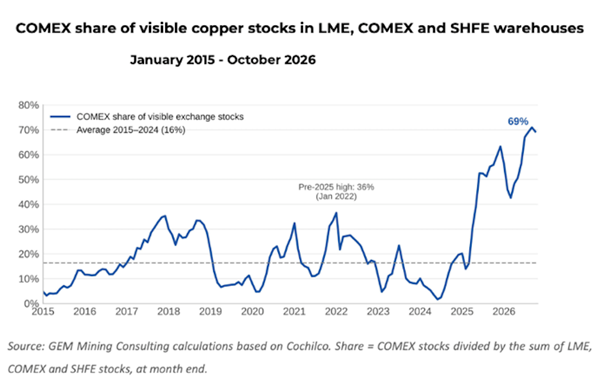
A study by GEM Mining Consulting found that nearly 70% of the world’s visible exchange copper stocks (like the LME, COMEX) are now held in the United States. This is a dramatic shift from historical patterns.
COMEX warehouses held 718,000 tonnes of copper in October, accounting for 69% of visible stocks across the London Metal Exchange (LME), COMEX and Shanghai Futures Exchange (SHFE).
Between 2015 and 2024, COMEX accounted for an average of just 16% of exchange inventories, with its share never exceeding 36%.
The current stockpile is roughly double the exchange’s previous record in Cochilco’s historical series dating to 1990.
Meanwhile, combined LME and SHFE inventories stood at 319,000 tonnes, 11% below their 2015–2024 average. (Mining.com)
The imbalance is creating a fragmented copper market, and explains conflicting forecasts for 2026. While the International Copper Study Group projects a global refined copper surplus of 104,000 tonnes, Goldman Saches estimates a deficit of roughly 950,000 tonnes outside the US.
The article goes on to say that If Washington proceeds with duties, inventories could remain concentrated in American warehouses, sustaining tightness elsewhere and potentially widening the COMEX premium ahead of 2027…
The analysis… highlights a growing challenge for the copper market: global supply balances may show a surplus while regional inventories, trade barriers and physical premiums point to a much tighter reality.
Price projections
What does it mean for copper and silver prices? The World Bank recently raised its 2027 copper price forecast to $13,000 per tonne or about $5.90 a pound. The bank’s October outlook is 18% higher than its April outlook.
The forecast leans on the demand side of the copper market equation, noting that “Higher energy costs and trade disruptions are driving up prices across a broad range of commodities, threatening to worsen inflation, food insecurity and economic growth.”
The outlook points to sustained demand for new copper supply, with electrification supporting industrial metals. The World Bank therefore expects its metals and minerals index to rise 25% this year. The index includes copper and iron ore but excludes precious metals.
The bank projects an average silver price of $62/oz next year, down 11% from $70 this year and below April’s $65 forecast. (Mining.com)
Conclusion
An article in City A.M., London’s free daily business newspaper, describes the scarcity trend we see unfolding. It first observes that,
Despite one of the most significant disruptions to global energy flows in decades, the global economy has continued to function remarkably smoothly. After an initial spike, prices for several key commodities have stabilised or even eased. Yet this apparent calm is deceptive. The reason the system has held together is due to governments, producers and consumers drawing down the buffers that normally protect the global economy from disruption. Those buffers are now approaching dangerous limits.
Inventories are being depleted at a remarkable pace. Global oil stockpiles have fallen to levels that senior industry executives describe as unprecedented.
US crude oil inventories dropped by 1.892 million barrels in the week ending October 23, marking the fourth consecutive weekly decline. The U.S. Energy Information Administration (EIA) estimates that global oil inventories fell by an average of 1.9 million barrels per day in the third quarter of 2026 and projects an additional drawdown of 0.7 million barrels per day through the fourth quarter.
It’s not just oil. Aluminum inventories are very thin, with combined stockpiles tracked by the London Metal Exchange, CME Group and the Shanghai Futures Exchange calculated to cover less than five days of supply. Global exchange inventories remain critically low.
And we all know what’s happening with copper, where stockpiles are 70% concentrated in the US — the fear of refined copper tariffs pulling metal from other countries and causing regional shortages.
The silver market is experiencing a severe structural deficit, with demand consistently outstripping both primary mining output and recycling, leading to a sixth consecutive year of shortfalls.
City A.M. summarizes:
When a critical input becomes scarce, producers seek substitutes, inventories are drawn down and existing capacity is pushed harder. These adjustments can be remarkably effective. They buy time. But time is ultimately what inventories represent. Every barrel released from a reserve, every tonne withdrawn from a warehouse, and every industrial workaround implemented today simply postpones the moment when supply and demand must once again be reconciled.
Macro sentiment like recession fears or a surging dollar often hammers copper on paper. However, as noted by Morgan Stanley analysts, visible global copper inventories are severely depleted outside of the United States, and Chinese physical premiums remain high due to smelter maintenance and scrap shortages.
Because copper has no substitutes for global electrification, green infrastructure and data centers, buyers must absorb these costs.
Physical tight supply creates a hard floor that macro currency trends cannot break.
Silver sits on the fence. Half of its demand is macro/monetary (like gold), and the other half is industrial (solar panels, electronics, automotive). When macro forces cause paper liquidations (like the heavy selloff we saw over the last month), silver gets hammered. But because industrial silver inventories have been in a structural deficit for consecutive years, physical buyers step in during deep price drops, using the physical crunch to overpower the paper-market short sellers.
For critical industrial inputs, physical reality always wins the tug-of-war in the end.
Richard (Rick) Mills
aheadoftheherd.com

Legal Notice / Disclaimer
Ahead of the Herd newsletter, aheadoftheherd.com, hereafter known as AOTH.Please read the entire Disclaimer carefully before you use this website or read the newsletter. If you do not agree to all the AOTH/Richard Mills Disclaimer, do not access/read this website/newsletter/article, or any of its pages. By reading/using this AOTH/Richard Mills website/newsletter/article, and whether you actually read this Disclaimer, you are deemed to have accepted it.