Warsh plus Friedman equals lowering rates – Richard Mills
2026.07.02
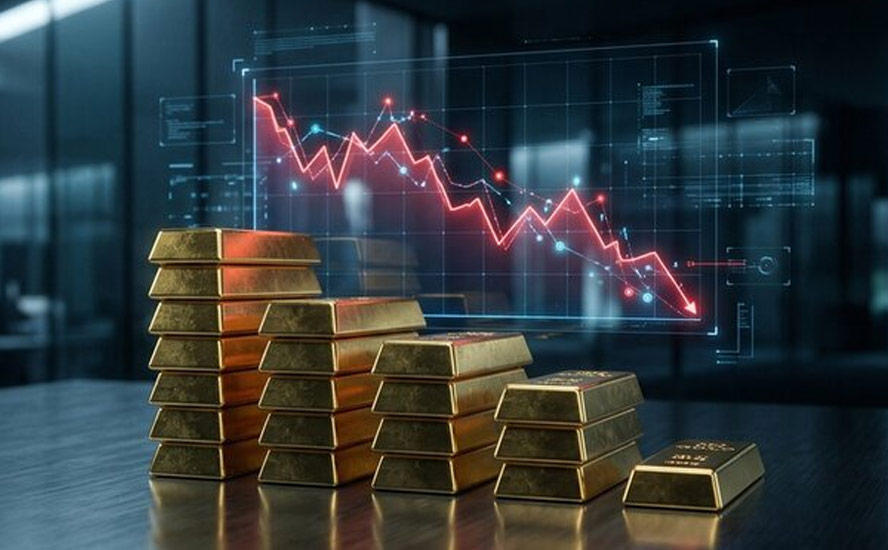
If we look at a one-year gold chart, we see gold has been quite volatile. From September 2025 to January 2026, spot gold climbed from $3,377.80 on Sept. 1 to an all-time record peak of $5,589.38 on Jan. 28.
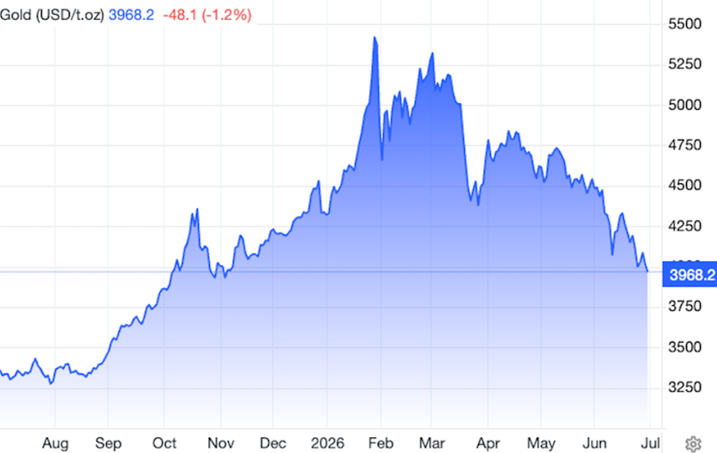
The next week saw a sharp drop to $4,628.90 on Feb. 2, then a stepped ascent to $5,304.10 a month later. Gold then began a steady retreat, losing about $600 in four months to the current price of around $3,900. What accounts for gold’s meteoric rise of ~$2,200 between September and February, and its equally dramatic pullback over the next four months, giving away half of the gains it made during the first four of eight months? And what’s next for the precious metal? The answers to these three questions comprise the remainder of this article.
Gold price strength: September 2025 to January 2026
Gold prices surged to new all-time highs in September 2025, largely driven by the Federal Reserve’s interest rate cuts, a depreciating US dollar, concerns over central bank de-dollarization, and heightened political friction over the Fed’s independence.
Key macroeconomic events that triggered this momentum include:
- Federal Reserve Rate Cuts: The highly anticipated 25-basis-point interest rate cut on Sept. 17 lowered the opportunity cost of holding non-yielding bullion, significantly boosting institutional and ETF investments.
- Concerns over Fed Independence: Escalating political tensions under the Trump administration—including public criticism of Fed Chair Jerome Powell and attempts to remove Governor Lisa Cook — sparked fears of political interference that could lead to currency debasement.
- Depreciating US Dollar: The U.S. Dollar Index (DXY) depreciated sharply heading into the fall, falling by more than 10% on the year and making dollar-priced gold cheaper for international buyers.
- Persistent Central Bank Accumulation: Central banks continued their historic buying streaks, aggressively shifting sovereign reserves away from the US dollar and into physical gold to hedge against geopolitical and geoeconomic fragmentation.
Gold price weakness: January 2026 to current
Something started to change for gold at the end of January- beginning of February. What was it?
The gold price correction following its late January 2026 record peak (near $5,600 per ounce) was primarily triggered by the nomination of Kevin Warsh as Federal Reserve Chair, which shifted rate hike expectations, and geopolitical de-escalations. This was exacerbated by profit-taking and thin market liquidity.
The rapid drop in gold was driven by a combination of macroeconomic, geopolitical and technical factors:
- Shifting Fed Policy Expectations: The immediate catalyst for the late-January sell-off was the nomination of Kevin Warsh as the next Federal Reserve Chair, which increased expectations for higher interest rates. Higher borrowing costs and real yields reduced the appeal of non-yielding assets like gold.
- Geopolitical De-escalation: Reports of progress in US-Iran nuclear talks and US-mediated negotiations eased Middle East tensions. This reduced safe-haven demand, causing a “fear trade” unwinding.
- A Stronger US Dollar: The US Dollar Index rallied as traders adjusted to the shifting monetary policy and resilient US economic data. A stronger dollar makes gold more expensive for international buyers.
- Algorithmic Sell-offs and Margin Calls: The explosive January rally left the precious metals market technically overextended. The spike in volatility led to algorithmic selling, forced liquidations, and significant outflows from gold ETFs.
Regarding the appointment of Warsh, who replaced Jerome Powell whose term ran out on May 15, Warsh’s hawkish stance triggered an immediate rally in the US Dollar Index.
As seen in the chart below, DXY jumped from 98.33 on May 14 to its current 101.18.

Warsh was initially seen as a monetary dove — one who prefers lower interest rates. He was Trump’s appointee to the Fed, and everybody thought he would be Trump’s toady and immediately cut interest rates. That was part of the reason for gold’s runup in the fall and into January.
In fact, Warsh views inflation primarily as a monetary phenomenon, adhering to the Milton Friedman dictum that persistent price rises are a choice made by the central bank.
Warsh prefers to focus on “trimmed-mean” inflation metrics rather than the broader Consumer Price Index (CPI) or Personal Consumption Expenditures (PCE). He argues that trimmed averages better filter out one-time price shocks — such as those caused by geopolitical events or tariffs — to reveal the underlying inflation trend.
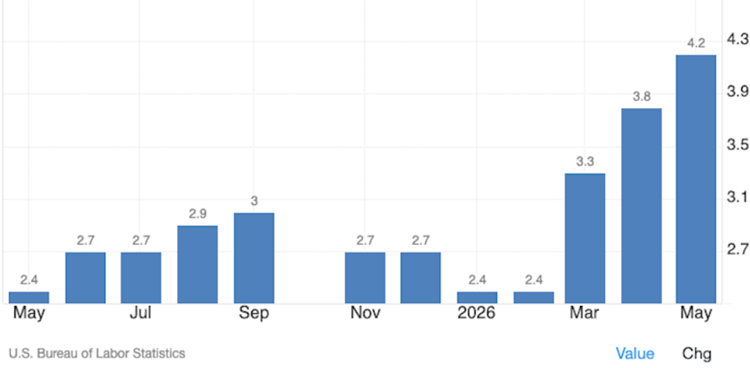
The annual Trimmed-Mean CPI for the United States increased to 2.9% in May 2026, up from 2.8% in April. Meanwhile, the Trimmed Mean PCE (Personal Consumption Expenditures) inflation rate—the Federal Reserve’s preferred trimmed measure—stood at 2.35% on an annual basis.
What’s clear is that inflation measures are sending different signals. The first chart below is the PCE Price Index. Remember this is the Fed’s preferred inflation measure.
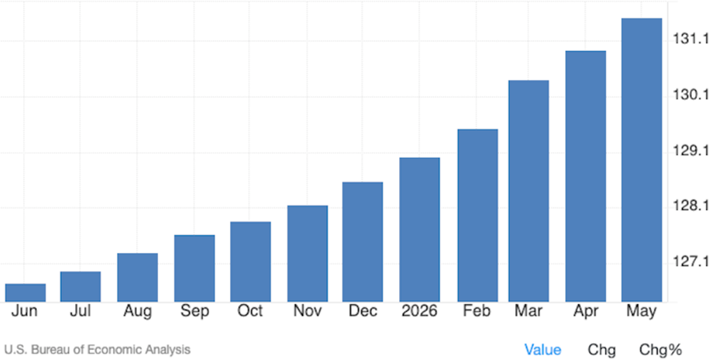
The Trimmed Mean PCE Inflation Rate in the graph below is practically the inverse of the PCE Price Index.
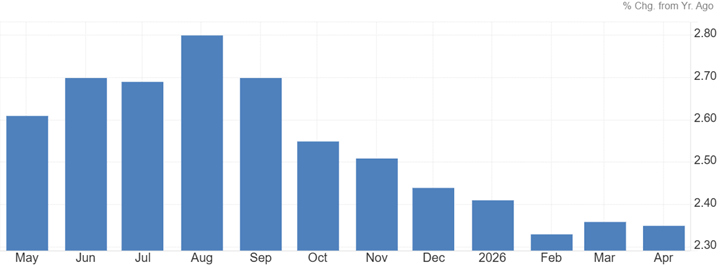
Source: Trading Economics
At its June 17 meeting, the Federal Open Market Committee voted unanimously to maintain the federal funds rate target range at 3.50% to 3.75%. This marked the first decision led by new Fed Chair Kevin Warsh.
Key Policy & Economic Details:
- Economic Projections: The committee revised its 2026 PCE inflation forecast upward to 3.6%, up from the previous 2.7% projection.
- Rate Path Divide: Although rates were held steady, the new “dot plot” indicates a hawkish shift. Nine of the nineteen officials now anticipate at least one rate hike later in 2026, while the remaining eight expect no change and one projects a cut.
- Policy Guidance: The Fed removed its previous forward-looking language regarding interest rate cuts from the official FOMC Statement.
- Next Steps: The committee will meet next on July 28-29, with updated rate projections scheduled for release on Sept. 16.
Warsh believes restoring the Fed’s credibility regarding price stability is paramount. He favors tightening monetary policy when necessary to ensure that temporary price shocks do not become embedded in long-term inflation expectations.
So, does this mean Warsh is going to raise rates? The market certainly thinks so, which has been a major drag on gold.
Rates are priced 50 basis points higher in the US a year from now, while the Eurozone and UK are seen not far behind.
Fortune ran an article on June 22 titled, ‘The Fed is fed up with inflation and will bring down the hammer with a series of rate hikes this year, reversing earlier cuts — BofA says’
The case for rate hikes is based on a jobs market rebound despite lower immigration, and inflation at 4% and above the 2% target for five years.
However, in our article on Warsh and interest rates, we said there are suggestions that Warsh is more dove than hawk, one being Warsh’s acknowledgement that monetary policy appeared “somewhat restrictive” in housing. Translation: mortgage rates are too high and Warsh is concerned about it.
Can, will the Federal Reserve lower rates? – Richard Mills
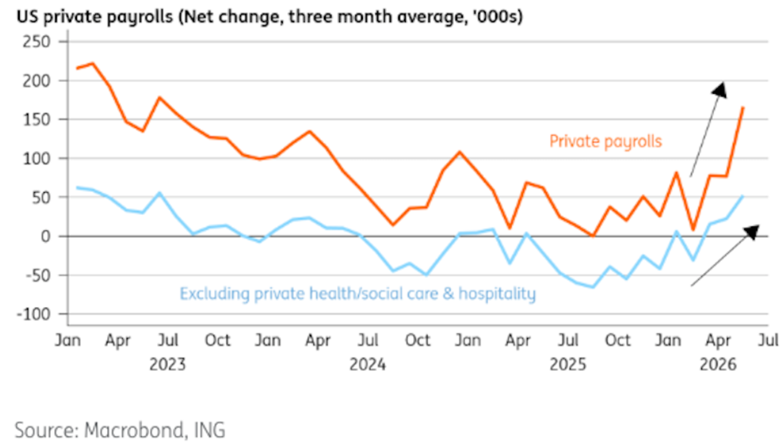
An ING economist states the Federal Reserve could end up easing policy next year. In a column, James Smith writes that The jobs market recovery looks less impressive when you exclude private health/social care and hospitality. Those sectors account for only a quarter of jobs, but two thirds of jobs growth so far this year. Yes, hiring has improved elsewhere, but not nearly as rapidly as the headline figures imply. And crucially, there’s very little sign that this improvement is feeding into broader wage pressure.
That’s one reason why inflation fears should start to recede as the year goes on. Another is housing. Kevin Warsh himself acknowledged this week that policy still looks restrictive when you look at what’s happening there. And as James Knightley argues in his excellent piece, rents are barely rising – something that should increasingly pull core CPI lower given housing’s huge weight in the index.
Add lower fuel prices, a reversal of recent air fare spikes and the fading impact of tariffs and the case for rate hikes looks much less compelling.
Back to the current gold price weakness — gold slipped below $4,000 on Monday for the first time since November — it seems to me there is another factor at play here: the war between the US/Israel and Iran.
We said at the top of the article that gold typically strengthens in response to geopolitical crises like wars. So why did gold start dropping, and continue falling, after the US and Israel attacked Iran on Feb. 28?
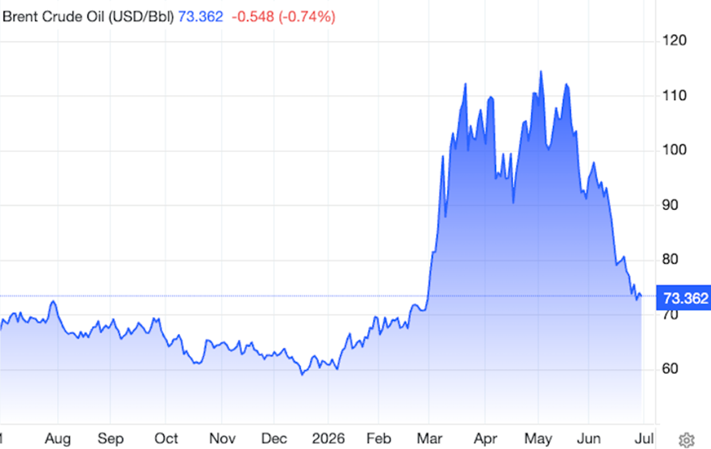
It has to do with inflation and the dollar. Gold failed to act as a safe haven primarily because the conflict drove up energy prices (past tense because oil has fallen from a one-year high of $113.78 per barrel on May 4 to its current $71.92 due to the ceasefire), which fuels broader inflation and expectations that central banks will raise interest rates. Because gold pays no yield, higher interest rates and a strong US dollar make it less attractive to investors.
When we look at the Dollar Index DXY, it also correlates with the war.
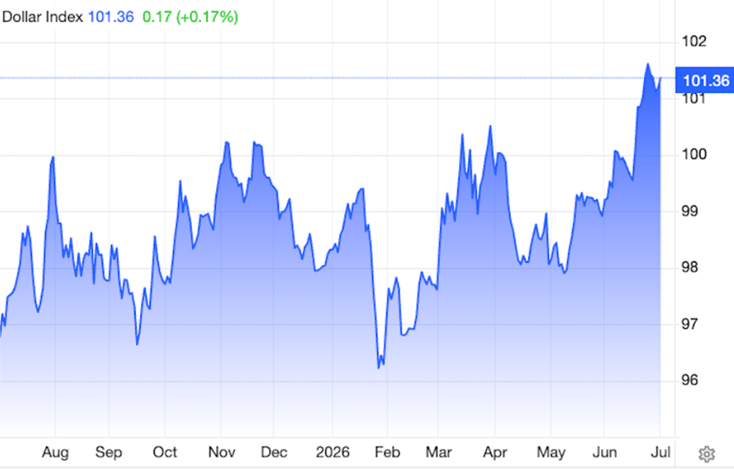
On Jan. 28 the dollar was at a one-year low of about 96. After the war started on Feb. 28, the index started to climb, mostly because the immediate increase to the price of oil meant higher inflation and with that usually comes higher interest rates. The upshot: bad for gold.
We can therefore say that the weakness in gold from Jan. 28 to present is due to a combination of the war with Iran, and the anticipation of Warsh being appointed Fed Chair, both of which raised expectations of higher inflation and higher interest rates.
What’s next
Let’s be clear. Kevin Warsh’s first Fed meeting was less about the result — keeping the pause on rate hikes or cuts — than reshaping the Fed into a leaner organization that is less about the markets front-running the Fed, than the Fed digesting market data and making decisions tasked for it by Congress.
One of those decisions is interest rates. Which direction will the Fed go from here? While the market is hawkish, expecting at least one hike by year-end, I’m thinking the opposite. Warsh may hold for a little longer but I’m betting on a rate cut in late 2026 or possibly into 2027.
Much depends on whether the Iran war comes to end. Continued price increase predictions are tied to the price of oil. If the ceasefire between Iran and the US holds, and the Strait of Hormuz opens up, supposedly for good, a large segment of price rises will be heading down — along with all the other commodities being held hostage by the war, including plastics, fertilizer, LNG, urea, aluminum, sulfuric acid, etc.
Warsh will have further justification to lower rates because of the new way the Fed will measure price increases. The Trimmed Mean PCE is falling, not rising. If they use this metric, it will hard for anyone to argue that inflation is an issue stopping rates from dropping.
The dot-plot will be gone, along with markets front-running the Fed based on a bunch of predictions that never come true. Unlike the self-important pontificating jawboning Powell and his predecessors, Fed Chair Warsh will simply go to the podium, announce the FOMC’s decision, then leave. No more tea leaves for the media and markets to read.
I agree with all that. At the end of the day, people need to understand that inflation is a symptom of excessive money-printing disease.
As the economist Milton Friedman famously summarized, “Inflation is always and everywhere a monetary phenomenon.” It is an artificial expansion of the intermediary medium, causing the nominal price of real commodities to skyrocket.
But an increase in the money supply does not cause isolated price spikes like the ones seen in oil.
To understand why, it helps to separate a change in “relative prices” from true “monetary inflation”.
When a specific commodity like oil spikes due to geopolitical conflict — such as the recent naval bottlenecks blocking the Strait of Hormuz or the disruption of global reserves — this is a microeconomic supply shock, not a monetary phenomenon.
Friedman’s maxim holds true for sustained, generalized price increases. A geopolitical crisis can make oil expensive overnight. But it only translates into long-term, economy-wide inflation if central banks panic and increase the money supply to help citizens pay for that expensive oil, effectively subsidizing the higher cost with printed currency.
When oil price spikes rippled through the economy, due to a supply-side shock, like higher oil prices and supply chain disruptions from the closure of the Strait of Hormuz, the widespread consensus is that central banks should maintain or even raise interest rates.
We wrote about Warsh potentially lowering rates. We came to the conclusion that as long as the war is on, and Warsh thinks it’s a microeconomic oil supply shock, we’re not going to get a cut.
What’s it going to take for gold prices to rise again, for the gold bull market to continue? The answer is dollar weakness and rate cuts.
The main thing is that Warsh is trapped as long as the war continues. He cannot lower rates in the face of what he believes is a temporary oil price shock.
So right now, we’re not going to get a cut. We’re going to get holds. And the next move will only be, as far as Warsh can tell, a rate cut when the timing is right.
What could change Warsh’s mind and lead to a rate cut, which would likely cause gold to resume its upward price movement?
First and foremost is the interest the federal government must pay on the national debt, currently sitting at $39.3 trillion. The average interest paid on its national debt obligations, including US Treasuries, is 3.39%. Current annual interest payments run at a seasonally adjusted $1.2 trillion and consume roughly 14% of the federal budget.
But the pressure on the US government is about to increase. That’s because it’s facing a massive maturity wall, with roughly $10 trillion in Treasury debt coming due and requiring rollover. This equates to approximately one-third of all outstanding marketable federal debt.
This is the main reason the government (i.e. Trump) requires lower interest rates, especially with mid-term elections coming up in November. The only reason we don’t have them already is because of the war, and the inflation that is “baked in the cake”.
Warsh wants lower rates too, but for different reasons. Because he’s using trimmed averages to measure inflation, it’s much lower than the CPI and the PCE indices. The United States Trimmed Mean PCE Inflation Rate was only 2.3% before the war started and it isn’t much higher now. Remember, trimmed averages filter out one-time price shocks — such as the oil price jump during the war with Iran — to reveal the underlying inflation trend.
This means, in Warsh’s view, inflation is less of a problem than others think, especially when oil is taken out of the index. When it’s added in, such as in the CPI or the PCE, it shows a temporary massive price shock to the economy, not true inflation.
Still, Warsh can’t cut rates until he sees the impacts of a lower oil price. Brent crude has already fallen to around $72. How long will it take for price drops to products directly affected by oil prices (like gasoline, diesel, jet fuel, plastics) and those indirectly affected, to reverberate through the world economy and show up in inflation indices?
It will take some time, and Trump is impatient. The midterms are coming. But until Trump can get the war over with, US interest rates are going to be on hold. There’s no way around it, in my opinion.
The role of central banks
There’s one last item to consider in this section on when the gold price will be free to resume its upward climb. Remember, central bank gold buying is an important demand driver for gold prices.
Central banks began accumulating unusually large, record-breaking amounts of gold in 2022, immediately following the onset of the Russia-Ukraine conflict and subsequent Western financial sanctions.
(Approximately $300 billion in sovereign Russian assets was frozen by the US and its allies following the February 2022 invasion of Ukraine.)
During that year, sovereign purchases reached 1,136 tonnes, the fastest pace of accumulation seen since 1967.
The buying was largely led by emerging market and developing economies — notably China, Poland, Turkey, India, and Kazakhstan —seeking to diversify reserves away from the US dollar and hedge against geopolitical risks.
And it didn’t stop. Between 2022 and 2025, central banks purchased a massive 3,892 tonnes of gold. It was one of the main antecedents for the gold price rising from about $1,100 an ounce in October 2022 to around $4,100 in October 2025, an increase of $3,000. Gold stayed above $4,000 as it rode to its peak of $5,589 on Jan. 28, 2026.
But something happened to central bank buying in early 2026, corresponding to a rapid fall in the gold price. Why was that?
In 2026, select central banks, particularly emerging markets, sold and swapped unusually large amounts of gold to address immediate economic pressures, fund increased government spending, and capitalize on historically high gold prices to defend their currencies.
The uptick in central bank sales was an obvious catalyst for downward price pressure in 2026. Official sector net selling, most notably from the central banks of Russia and Turkey, caused noticeable market corrections even though sovereign purchasing remained robust overall.
And ETF investors
Sovereign actions were a large part of the gold price correction. But they weren’t the only factor. Retail was also in on the action, particularly the sale of gold-backed exchange traded funds, or ETFs.
Gold ETF investors sold heavily in early 2026 to lock in profits after bullion hit historic all-time highs in January.
The investor pullback was driven by several key factors:
- Aggressive Profit-Taking: Following a historic rally that pushed gold past $5,500 an ounce, early adopters and short-term traders rushed to liquidate positions and secure gains.
- Hawkish Fed Expectations: Rising inflation reports and strong employment data forced markets to reassess US monetary policy, with investors pricing in “higher-for-longer” interest rates.
- Stronger Dollar and Real Yields: Gold struggled as the US Dollar Index (DXY) reached its highest level since March, while rising real Treasury yields increased the opportunity cost of holding non-yielding gold.
- Decline in Safe-Haven Demand: Easing geopolitical tensions (such as de-escalation in the Middle East) reduced market uncertainty, leading investors to reallocate capital toward risk-on equity assets.
- Liquidity-Driven Deleveraging: During broader market volatility, many investors liquidated their most liquid assets, like ETFs, to raise cash, contributing to the downward price pressure.
To summarize, retail investors started selling their gold ETFs after the central banks started liquidating their gold reserves – retail gold selling was now setting the daily action in gold’s price (gold’s price was being heavily influenced by the ebb and flow of consumer sentiment). This combination clobbered the gold price, and it hasn’t yet recovered. Gold has retreated around 29% since January’s peak.
But there is hope, and it comes in the form of renewed central bank buying. According to The Conversation, central banks now hold their highest quantity of gold since 1975, and sovereign purchases have averaged around 1,000 tonnes annually in recent years.
A recent World Gold Council survey revealed a record 45% of central banks expect to increase their gold reserves over the next 12 months.
(Although one bank, Société Générale, said that ongoing uncertainty in the Middle East and disruptions to global energy markets have pushed gold buying to the back burner among central bank priorities. Still, when using a six-month time methodology rather than a one-year, analysts at the bank said they expect central banks to purchase between 100 and 120 tonnes of gold over the remainder of the year.
“This is roughly double the volume recorded in the first four months and aligns with our broader call for a resumption in central bank buying,” the analysts said, via Kitco News.)
And then there’s this:
Gold officially exceeded US Treasury securities as a central bank reserve asset at the end of 2025, marking the first time in roughly three decades that gold became a larger holding than US debt. By early 2026, bullion accounted for 27% of global central bank reserves, compared to 22% for US Treasuries.
Also, a recent survey found that for the first time, more central banks plan to cut dollar allocations than increase them in the coming decade as political risks associated with the US currency rise.
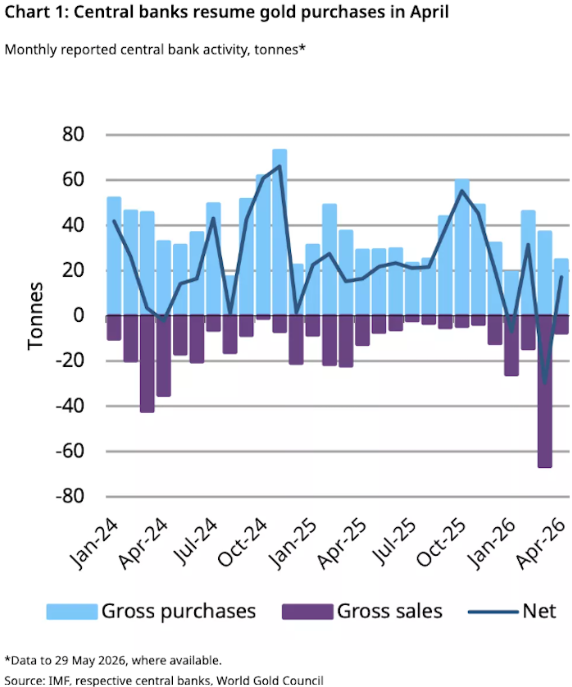
The switch from sellers to buyers is already happening amongst central banks. The World Gold Council says CBs resumed net gold purchases in April, having bought 19 tonnes. This was a rebound from the sizeable net sales reported in March, as the chart below shows.
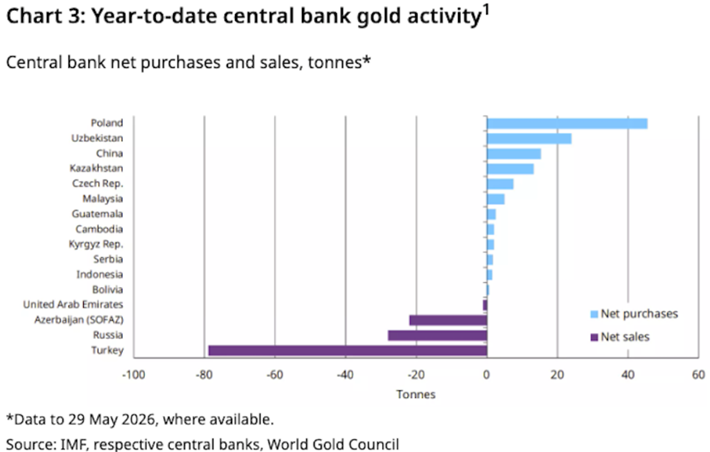
A second chart shows Turkey, Russia, Azerbaijan and United Arab Emirates are net gold sellers year to date, shown in purple, while several countries in blue are net buyers YTD. The top three are Poland, Uzbekistan and China.
To be clear, gold has not yet rebounded. Central bank buying is picking up, and emerging-market countries will stop selling as oil prices come down and they no longer need to sell gold to stabilize their currencies.
Retail remains unconvinced. While WGC data shows gold ETFS registered their strongest weekly net inflows the third week of June since mid-April, there were 16 metric tons of net outflows in May and continued outflows in the first half of June.
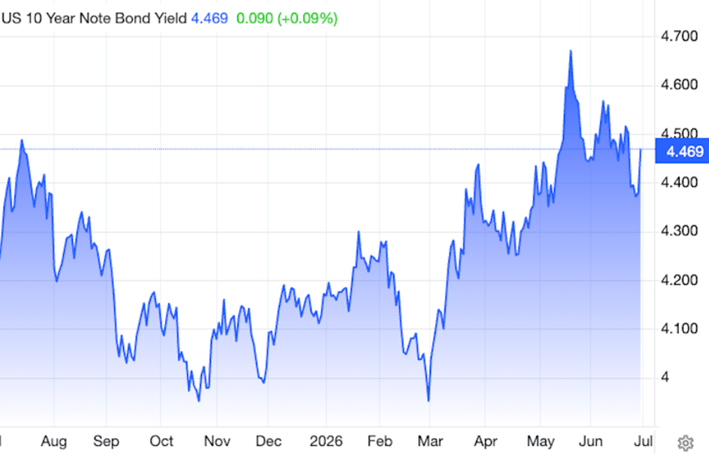
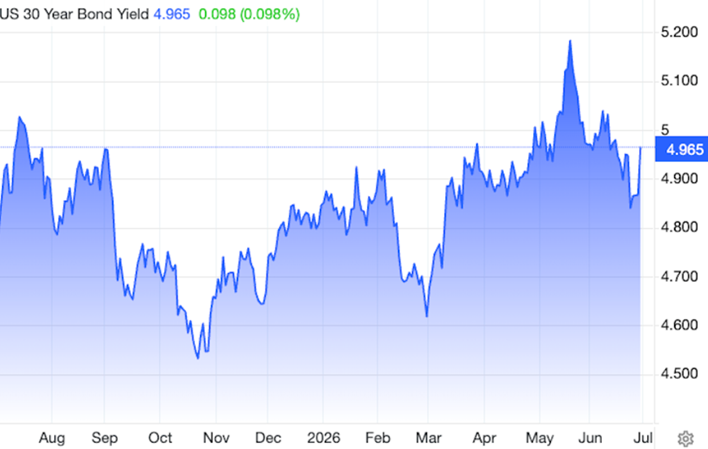
Arguably, ETF investors will come back in as the gold price starts to rise, interest rates come down — US yields already have — and the dollar weakens. When all three of these factors coalesce, we could be looking at the perfect storm for gold.
Conclusion
We are currently in a holding pattern for gold to resume its bull market that began in 2022 and ended, temporarily imo, in January 2026. What needs to happen? First, the war in Iran must end for good. No more fragile ceasefires and sneak attacks. The continuing Middle East conflict is the only reason interest rate cuts haven’t happened yet.
Let’s be honest. New Fed Chair Kevin Warsh was appointed by Trump because he favors lower interest rates. But Warsh is not going to be a Trump toady. He’ll lower rates when he’s good and ready. That won’t happen until the war ends permanently, oil prices stay low for an extended period, and other commodities tied to the price of oil start coming down too. Once inflation is proven to have been a temporary supply shock, Warsh and his fellow Fed board members can comfortably start lowering rates.
When they do, look for gold and silver to soar.
Remember, Warsh views inflation primarily as a monetary phenomenon, adhering to the Milton Friedman dictum that persistent price rises are a choice made by the central bank.
Warsh prefers to focus on “trimmed-mean” inflation metrics rather than the broader Consumer Price Index (CPI) or Personal Consumption Expenditures (PCE). He argues that trimmed averages better filter out one-time price shocks — such as those caused by geopolitical events or tariffs — to reveal the underlying inflation trend.
If the supply of oil drops dramatically but the money supply increase stays on the same trajectory as before the war, the price of oil will still shoot up, and so will the cost of everything related to it as mentioned at the start of the article. Oil, and it’s many by-products, and all the other commodities blocked by the Strait closure have genuinely become scarcer and more valuable relative to everything else. As for inflation it should go back to it’s previous trajectory, which before the macro price shocks, when using trimmed-means, was very much within Fed guidelines.
Casey Research founder Doug Casey believes we often put the cart before the horse when thinking about inflation. The renowned investor, author and speaker states,
“Inflation” occurs when the creation of currency outruns the creation of real wealth it can bid for… It isn’t caused by price increases; rather, it causes price increases.
Inflation is not caused by the butcher, the baker, or the auto maker, although they usually get blamed. Inflation is the work of government alone since government alone controls the creation of currency.”
At Ahead of the Herd (AOTH) we believe it’s just a matter of time until people wake up and start asking “When is the Fed going to lower rates?” The cynic in me, and my analysis says before November mid-terms – as long as the economic price shocks that resonated through the US economy from traffic being halted thru the Strait start to dissipate. After all, Warsh’s beloved trimmed rates were 2.3% before the conflict.
Lowering rates will weaken the dollar and ignite gold and silver.
Richard (Rick) Mills
aheadoftheherd.com

Legal Notice / Disclaimer
Ahead of the Herd newsletter, aheadoftheherd.com, hereafter known as AOTH.Please read the entire Disclaimer carefully before you use this website or read the newsletter. If you do not agree to all the AOTH/Richard Mills Disclaimer, do not access/read this website/newsletter/article, or any of its pages. By reading/using this AOTH/Richard Mills website/newsletter/article, and whether you actually read this Disclaimer, you are deemed to have accepted it.