Gold Miners Bullish Percent Index falls to 0, a sign of ‘total capitulation’ as contrarians see opportunity – Richard Mills
2026.06.11
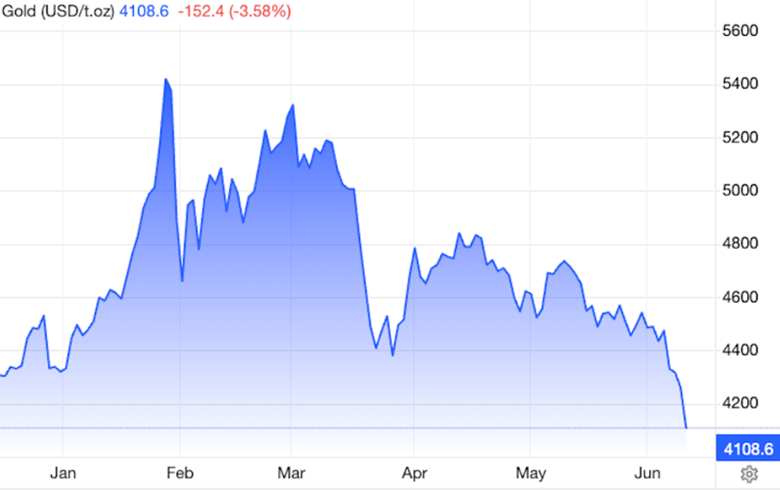
Gold prices extended their decline toward $4,100 per ounce on Wednesday, reaching levels last seen in late November 2025, as US inflation data largely matched expectations and the Iran conflict intensified. Headline inflation rose to 4.2% in May, its highest since April 2023, fueled by soaring energy costs tied to the Iran conflict, while the core rate climbed to a seven-month high of 2.9%. (Trading Economics)
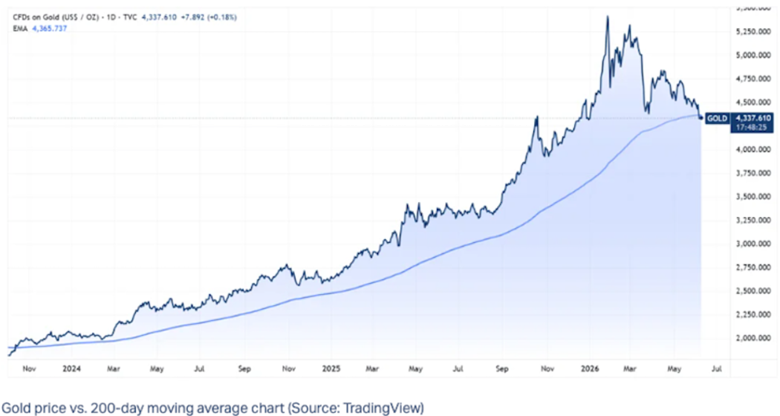
Gold’s fall from grace — it reached a record-high $5,589 on Jan. 28, 2026 — is graphed below in a six-month chart.
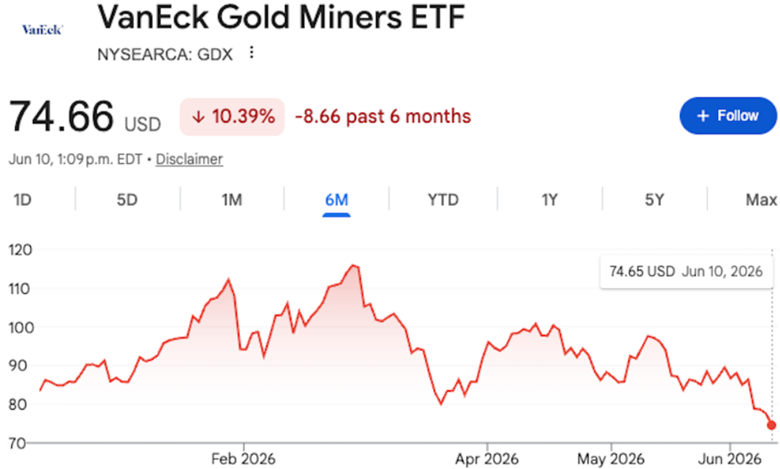
Gold’s performance is often compared to gold mining stocks, despite physical gold (bullion) and gold ETFs being quite different investment vehicles than the firms that explore for and mine the precious metal.
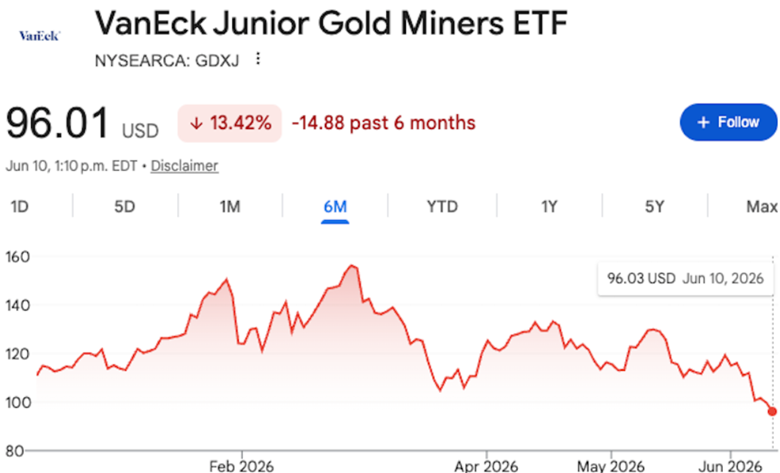
While gold is currently down, it’s got nothing on the gold stocks which have plunged far into oversold territory. Because there are so many gold stocks, which includes the hundreds of junior explorers, ETF proxies are often used to measure their performance. Two of the most popular are the Van Eck Gold Miners ETF (GDX) and the Van Eck Junior Gold Miners ETF (GDXJ). GDX is down 10.39% over the past six months, while GDXJ has fared slightly worse, at -13.42%.
According to The Deep Dive, “The miners got hit harder because they are basically gold with operating leverage and equity-market baggage attached.”
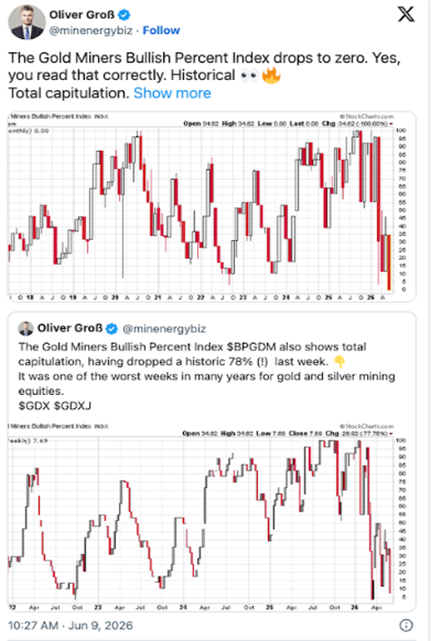
But the really telling picture of a sector in decline is the Gold Miners Bullish Percent Index, which has fallen to a jaw-dropping 0.
This index, referred to by its symbol $BPGDM on StockCharts, is not a price chart. Rather, it is a breadth and sentiment indicator that measures the percentage of gold mining stocks that are technically in uptrends versus how many have already rolled over.
This indicator is used as a tool to decide when to buy or sell gold mining stocks, but since gold stocks often move in tune with gold or silver, it can be a useful tool when determining the direction of the entire precious metals sector. The index can be used in conjunction with a gold price chart, or multiple other tools, to watch for additional confirmations of a trend.
The scale runs from 0 to 100. When readings are above 70-80%, it means most stocks are already extended. When readings fall below 30%, it tells you most stocks have already corrected. (Streetwise Reports)
The StockCharts image posted on X by Oliver Groß shows the Gold Miners Bullish Percent Index falling off a cliff. From 100 in January the index plummeted to 7.69 on June 5 after a decline from 30.77 in early June. After falling a historic 78% last week, one of the worst weeks in years for gold and silver equities, BPGDM hit 0 on Tuesday, June 9.
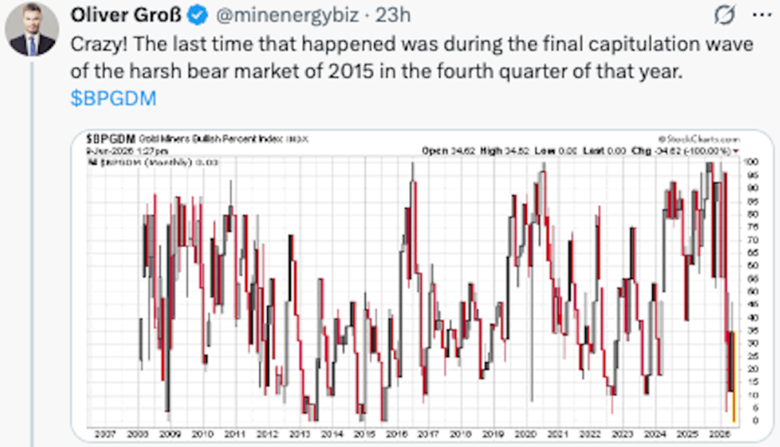
In another tweet, Groß compares the current capitulation to the gold bear market of 2015:
The Deep Dive states: “A zero reading means the indicator is no longer describing routine weakness. It shows that the internal technical base of the gold-mining group has been cleared out, at least by this measure.”
Metals and Miners blog argues “The speculative froth has been entirely violently wrung out of the market, leaving only the most hardened, value-focused capital behind.”
Streetwise Reports says “we have clearly moved from optimism… to stress… to fear.” The silver lining in the cloud, though, is we have likely reached a bottom:
“The selling has already occurred. The damage, for the most part, is already behind us rather than in front of us.”
The damage to gold
Still, there is no getting away from the fact that gold has taken a massive hit over the past six months.
Earlier this week, Market Index reported that gold fell below its 200-day moving average for the first time since October 2023.
A 3.2% drop last Friday ended the 660-day historic run — the third-longest in 50 years.
That puts it into official bear market territory, having declined more than 20% from its Jan. 28 all-time high of $5,598/oz. The culprit was a robust US jobs report, which the market interpreted as fueling inflation and scuppering the chance of an interest rate cut this year.
The most important question now is how does gold perform after a 200-day moving average breach?
According to Market Index,
A close below the 200-day is widely viewed as a sign that long-term bullish momentum has weakened…
Well, obviously. But then there’s this:
Analysts remain largely bullish on gold. The latest from UBS (1-Jun) expects gold to rebound to US$5,500/oz by year-end, as elevated debt, US fiscal deficits and continued central bank reserve diversification outweigh the current pressures from higher energy prices, US dollar strength and tighter Fed policy.
Market Index also references the World Gold Council, which argues, counterintuitively, that gold could benefit from a rate hike. Say what? Apparently gold has posted positive returns more than 50% of the time following Fed hikes. That’s because the US dollar’s movements matter more than rates, and “the consensus point to a weaker dollar ahead on growth and yield convergence and diversification away from US assets.”
The bottom line: The 200-day breach makes for an ominous headline, but history says it’s more often a pause than a peak.
Time to buy?
So, it’s not all bad. In fact, opportunity is knocking.
Metals and Miners acknowledges that “the sentiment toward the companies pulling the metal out of the ground has reached a level of despondency rarely seen in modern market history. But…
“This extreme pessimism is not a warning sign; it is the exact contrarian setup that precedes massive, face-ripping rallies in the precious metals space. When the last marginal buyer throws in the towel, the bottom is in.
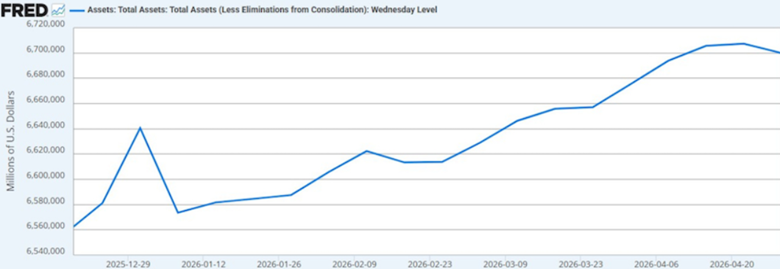
“Meanwhile, the macroeconomic fundamentals driving the need for hard assets have never been stronger. The Federal Reserve has quietly engaged in stealth quantitative easing, adding over $200 billion to its balance sheet since the start of the year without a formal announcement.”
“What remains is a pure, unadulterated fundamental case for gold and the miners: a world drowning in debt, a central bank forced to monetize it, and a mining sector priced for absolute ruin.”
Consider the following:
- Extreme Sentiment Washout: The Gold Miners Sentiment has plunged into the bottom 10% of its historical distribution, signaling peak pessimism and a classic contrarian buy signal.
- Historic Valuation Disconnect: Major producers like Newmont are trading at record-low P/E multiples despite generating record-high profits, creating an asymmetric risk/reward setup.
- Bullish Percent Collapse: The Gold Miners Bullish Percent Index has crashed from near 100 to [0], indicating that virtually all bullish excess has been purged from the sector.
- Stealth Quantitative Easing: The Federal Reserve has silently expanded its balance sheet by over $200 billion since January 1st, providing the monetary fuel for the next leg up in hard assets.
- Geopolitical Premium Evaporating: As the Iran conflict de-escalates, the temporary fear premium in gold is being replaced by the structural reality of commodity shortages and entrenched inflation.
“When everyone is running for the exits, it might be time to pay attention.” That how Streetwise Reports headlined a March 19 article which, at the time, saw the Gold Miners Bullish Percent Index fall to 18.
Author John Newell of John Newell & Associates rightly asserts that contrarian investors with good timing are generally winners:
In this business, you do not get paid for following the crowd. You get paid for recognizing when the crowd has already acted, and when the next move is likely to come from the other direction.
When the Bullish Percent Index drops into these kinds of levels, it usually means the emotional sellers have already done their selling…
So is now the time to jump back in? “Not so fast,” Newell appears to be saying. He says if you study enough cycles, a pattern emerges:
The best opportunities rarely come when things feel clear and easy. They come when sentiment is washed out, when indicators like the Bullish Percent Index are at extremes, and when most participants are focused on protecting capital rather than deploying it.
That is the environment where longer-term positioning begins…
This is not a signal to rush in blindly. It is a signal to start paying attention again.
It is time to revisit companies that looked interesting at higher prices. To take a fresh look at projects, management teams, and share structures. To begin thinking about scaling into positions while others are stepping away.
Markets do not reward comfort. They reward preparation and perspective…
For those willing to think differently, this is often where the groundwork for the next move is laid.
Not when things feel easy.
But when they feel uncertain.
Conclusion
I agree with most of Newell’s comments. The time to buy is usually when there’s blood in the streets, and for gold mining companies, that blood is coming fast and thick.
Is the bull run in gold stocks over? No, but it’s hit the pause button. There are certainly bearish signals. The Gold Miners Bullish Percent Index falling to zero lines up with meaningful pullbacks in both GDX and GDXJ — the gold miners’ ETFs.
Major producers like Newmont are trading at record-low P/E multiples despite generating record-high profits.
Gold crashed through its 200-day moving average for the first time since October 2023, ending a remarkable 660-day run that is the third longest since record-keeping began in 1970.
While near-term pullbacks for gold and silver caused by hot inflation data and fluctuating interest rates present volatility, longer-term macroeconomic conditions continue to support a bullish outlook for both metals.
Gold and silver pullbacks temporary
Richard (Rick) Mills
aheadoftheherd.com

Legal Notice / Disclaimer
Ahead of the Herd newsletter, aheadoftheherd.com, hereafter known as AOTH.Please read the entire Disclaimer carefully before you use this website or read the newsletter. If you do not agree to all the AOTH/Richard Mills Disclaimer, do not access/read this website/newsletter/article, or any of its pages. By reading/using this AOTH/Richard Mills website/newsletter/article, and whether you actually read this Disclaimer, you are deemed to have accepted it.