 RSS Subscribe
Retail wearing rose tinted glasses, got gold? – Richard Mills

2026.08.08
The yen carry trade is an investment strategy where traders borrow Japanese yen at a very low interest rate, convert it into higher-yielding foreign currencies, and invest in global assets to pocket the interest rate gap.
During the major August 2024 yen carry trade unwind, a sudden surge in the Japanese yen triggered a rapid global deleveraging event. A violent market-wide sell-off ensued, but it was not a structural, macroeconomic “dumping” of assets by retail households. Instead, it was a mechanical, forced liquidation concentrated among institutional players
This forced hedge funds and institutional traders to sell highly appreciated global risk assets —predominantly US tech stocks, Japanese equities (causing a historic plunge in the Nikkei 225), and cryptocurrencies like bitcoin — to cover sudden losses from a surging yen.
Before the market shock, the estimated total size of the global yen-funded carry trade bounced between $250 billion and $500 billion for the core leveraged trade. A later analysis across the five-day peak panic window shows $1.1 trillion cross border was liquidated. The single largest portion of the liquidated “cash” did not enter a new investment; it vanished back into Japan to close out loans.
But massive pockets of capital are using yen-denominated debt to fund long-duration risk assets, heavily propping up global artificial Intelligence (AI) and technology equities. A violent spike in the yen would still force mechanical liquidations across these highly concentrated tech portfolios. An unwind transforms previous marginal buyers into aggressive marginal sellers, stripping away the liquidity that inflates tech valuations.
Following the 2024 yen carry trade unwind shock, roughly 50% of the active trade was unwound within the first two weeks. This equated to an immediate, forced buyback of roughly $200 billion to $250 billion worth of Japanese yen to settle debts.
This caused the S&P 500 to plummet roughly 3% in a single day (August 5, 2024) and about 8% from its local high. However, because the panic was structural rather than fundamental, the index completely recovered its losses within a few weeks.
When the dot-com bubble burst in March 2000, high-net-worth (HNW) investors and general market participants faced massive equity losses. Gold prices initially languished near multi-year lows around $255–$270 an ounce through 2001, but the crash ultimately sparked a massive multi-year capital rotation into hard assets, laying the groundwork for gold’s historic bull run later in the decade.
During the commodities boom that followed the good times started rolling again and things got even better with the 2007 housing boom, until another market crash — the one that caused the Great Recession.
Remember in 2008 money that, up to then, had been safely locked away in the financial system became idle liquid retail cash looking for safety. A significant portion of this displaced cash was directed to physical gold by High Net Worth (HNW) retail investors.
These same retail investors also bought gold heavily during the 2020 covid-19 pandemic. Driven by unprecedented global economic panic, massive government stimulus packages, and ultra-low interest rates, retail interest propelled gold prices to a then-historic record of over $2,070 per ounce in August 2020.
Total assets held by global gold ETFs surged by over 30% during the year, reaching an all-time peak of 3,915.8 tonnes. Retail investors were also aggressively buying physical gold bars and coins, causing a massive surge in Western retail demand that more than trebled U.S. bullion purchases from 20 tonnes in 2019 to 66 tonnes in 2020.
Could we be looking at a “rinse and repeat” event, with a large pool of capital being made available to retail investors again?
At AOTH we believe sooner or later Japan has to raise interest rates due to the plummeting yen (most analysts are calling for a rate hike this year), which currently trades at 157.64 per US dollar, rising import and energy costs, and mounting inflation.
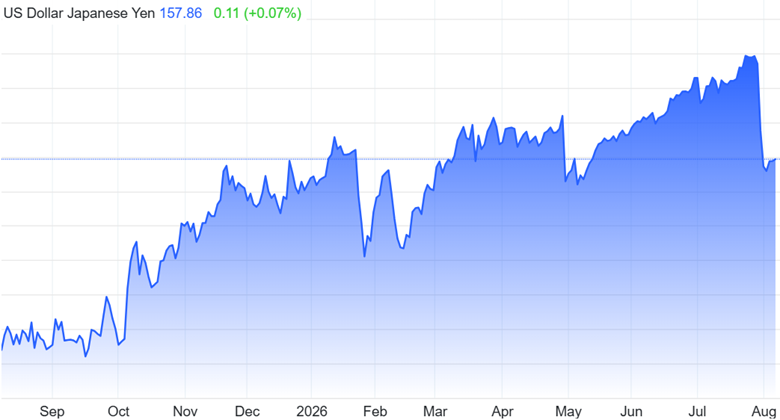
While it has pulled back from a severe four-decade low near 164 reached in late July 2026, it is still exceptionally weak. This multi-decade low matches levels not seen since 1986.
The US government is going to great lengths to stabilize Japan’s currency. Treasury Secretary Scott Bessent said on Tuesday the Trump administration will do “whatever it takes”.
“We will do whatever it takes to support them in a way that helps the American economy, the American taxpayer,” Bessent said in an interview on CNBC two days after confirming the Treasury had joined Japan’s finance authorities in an intervention last week to prop up the yen.
Bessent said the yen’s substantial undervaluation could trigger other economic problems or competitive devaluations of other currencies “which is unhealthy.”
The U.S. Treasury chief did not discuss the mechanics of U.S. participation in Friday’s joint intervention with Japan. He said that he was happy that the Japanese government wants to use a COVID-era Federal Reserve backstop for key central banks, the Foreign and International Monetary Authorities Repo Facility, which would allow the Bank of Japan to borrow up to $60 billion to support the yen.
“The FIMA facility was done in 2020, the size of the bond market was much smaller then, so I think it would be reasonable for the Fed to consider up-sizing the facility,” Bessent said, adding that its purpose was to “protect the U.S. economy and keep any volatility offshore.”
US yen intervention marks perfect storm in forex, bond markets
It’s clear to us at AOTH that Bessent fears a chaotic unwind of the yen carry trade because a sudden, disorderly reversal would severely threaten the $29 trillion US Treasury market, crash global equities including global artificial Intelligence (AI) and technology equities and spark a trade-disrupting Asian currency war.
(Artificial intelligence and technology equities drive a historic concentration in the U.S. stock market. Mega-cap tech and AI-linked firms account for roughly 40% of the S&P 500’s total market value.)
“Quarterly data from Japan’s Ministry of Finance (MOF) released on Friday showed authorities intervened on three days from April 30 through May 6, when market liquidity was thin due to Golden Week public holidays.
The largest operation amounted to 6.28 trillion yen ($39.64 billion) on April 30, surpassing the previous single-day record of 5.92 trillion yen set on April 29, 2024, showed MOF figures dating back to 1991.
The latest data provides a detailed daily breakdown of the previously disclosed record monthly intervention of 11.7 trillion yen conducted over April 28 through May 27.
The intervention helped lift the yen from a near two-year low of 160.725 per dollar to around 155 by May 6 but did not reverse the currency’s broader downtrend.” Reuters
Corporate equity wealth owned by households
According to Investopedia, corporate equity wealth owned by households has reached record levels largely due to prolonged bull markets fueled by massive technology and artificial intelligence rallies, strong corporate profits, and high household portfolio allocation into stocks.
Households now have allocated a higher percentage of their total financial assets to equities than during past peaks like the dot-com era.
Federal Reserve historical data demonstrates a strong correlation between peak equity concentration in household wealth and subsequent major market drawdowns. When household cash reserves are depleted to chase rising equity values, the market loses the marginal buyers required to sustain elevated valuations.
Household equity allocation has historically been one of the most reliable long-term indicators of stock market corrections and long-term return potential. Major historical saturation points in household equity allocation—such as in 1968, 2000 (Dot-Com bubble), and 2021—were followed by prolonged flat returns, high inflation drag, or sharp corrections.
When household equity allocation drops to major historical saturation points (market bottoms), investors traditionally rotate heavily into conservative, income-generating, and tangible assets to preserve wealth – government bonds, precious metals and real estate.
According to Federal Reserve data, household equity wealth is split into three main buckets:
- Direct Brokerage Accounts. This is the most visible bucket. It includes individual stocks (like tech giants), exchange-traded funds (ETFs), and mutual funds held in regular retail brokerage accounts. This bucket is disproportionately owned by ultra-high-net-worth individuals.
- Defined Contribution Retirement Plans: A massive portion of middle- and upper-class equity wealth is held indirectly via employer-sponsored 401(k)s, 403(b)s, and Individual Retirement Accounts (IRAs). Within these plans, money is automatically channeled into equity mutual funds and target-date funds. (Trillions of dollars are held in these employer-sponsored and individual retirement accounts. Investors can use them to gain exposure to both paper gold (like ETFs and mining stocks) and physical bullion, though the rules differ significantly depending on the account type.)
- Private Business Equity: The Federal Reserve data groups corporate equities with closely held private “C-corporations”. A significant portion of wealth for the top 1% to 10% is tied up in the private equity of businesses they own or have invested in privately.
Liquidity, from one to three, ranges from instantaneous to completely frozen, depending on which bucket the wealth sits in.
While the number of people holding direct brokerage accounts is relatively low, the monetary value packed inside taxable brokerage accounts is staggering. This is because of extreme wealth concentration:
- The Top 1% Heavyweight: The wealthiest 1% of Americans hold roughly $26 trillion in corporate equities and mutual fund shares.
- The Bottom 50% Share: Conversely, the bottom half of the US population holds only about $500 billion in total stock wealth (roughly 1%). For these families, nearly 100% of their equity exposure sits inside employer-sponsored retirement plans rather than brokerage apps.
Now, if we pull up a Federal Reserve chart of corporate equities owned by households, shown as a percentage of financial assets, we find something very interesting.
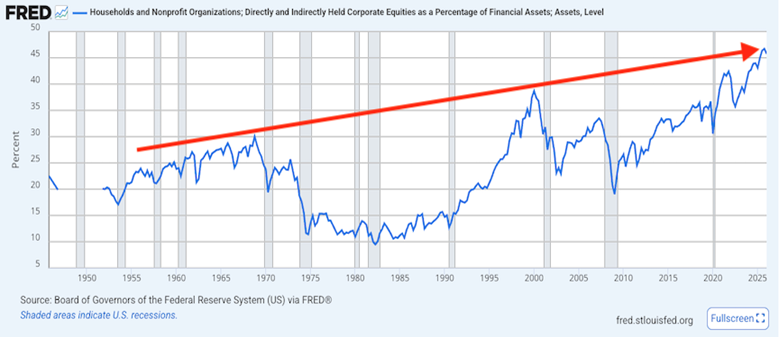
Every time there is a peak in stock ownership as a percentage of household wealth, it is followed by a market crash. Let’s look at the highs and lows going back to the high of 1968 in Q4 at 30.03%, the next record high doesn’t occur until Q1 2000 when stock ownership as a percentage of household wealth was 38.68%. The all time record was hit in Q4, 2025 at 46.71%
Every time there is a new high its quickly followed by a liquidation of stocks owned by retail households.
Taking the long view, the chart shows three significant highs, the first two followed by stock liquidations. In sum, we’ve had three highs and two subsequent crashes since 1950.
Is a third crash in household equities beginning? It’s impossible to tell, but there is an ominous warning. If we draw a trend line (in red) we see when stock ownership as a percentage of household wealth hit 46.71%.
It is telling to note that the difference between the first two highs (Q4 1968 and Q1 2000 is 8%). The difference between Q1 2000 and Q4 2025 was also 8%. The next household equity crash could be happening right there in the chart. The last data point is Q1 2026 at 45.76%, another 8% rise from the last record high. Also of note are the lows after previous crashes, those are major slides shaving trillions off household financial assets.
It might not be a yen carry trade unwinding to cause a sell off and a pivot to precious metals, there are other forces at play. The jobs report out Friday revealed a major chink in the US’s economic armor:
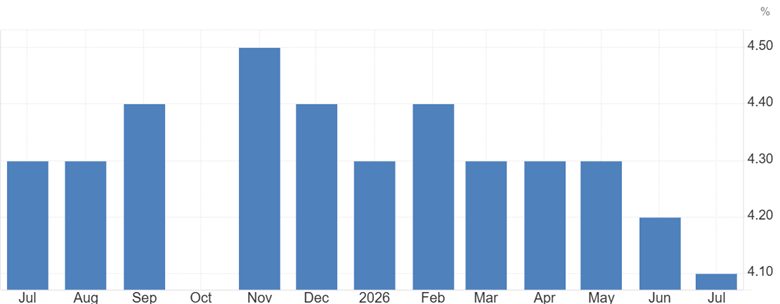
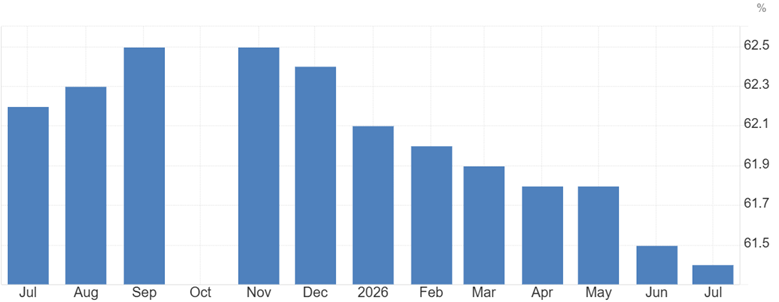
Nonfarm Payrolls decreased by 23,000 in July, missing consensus estimates by a wide margin. May and June numbers were revised down by a combined 103,000 jobs. The unemployment rate ticked down from 4.2% to 4.1%. It fell because hundreds of thousands of workers left the labor market entirely shown by the participation rate sliding to 61.4%, hitting its lowest level since early 2021.
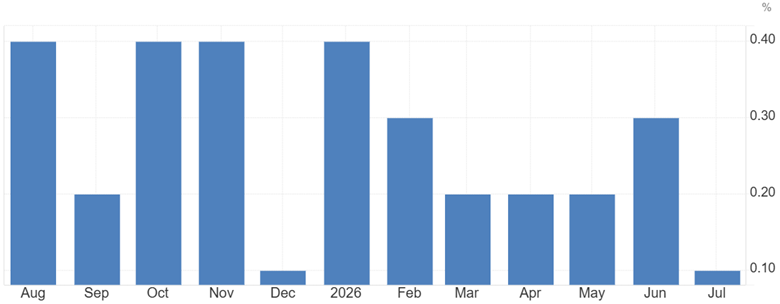
Annualized average hourly earnings growth slowed down to 3.2%, pointing to cooling wage pressures.
Here’s BNN Bloomberg’s take on the numbers:
The U.S. job market stalled unexpectedly last month, delivering a political blow to President Donald Trump three months ahead of midterm elections and complicating decision-making for the inflation fighters at the Federal Reserve.
Employers cut 23,000 jobs in July. And Labor Department revisions slashed 103,000 jobs from May and June payrolls.
The unemployment rate fell but for the wrong reason: Thousands of people dropped out of the labor market so fewer people were competing for work.
The July jobs numbers from the Labor Department Friday marked a sharp setback for the American labor market and for Trump less than three months before his Republican party seeks to keep full control of Congress in the midterm election…
“We can’t really put lipstick on a pig here,’’ said Daniel Zhao, chief economist at the jobs website Glassdoor. ”This is not a great report for July.’’
Rose tinted glasses
Many analysts and market historians warn that artificial intelligence is in a speculative stock bubble driven by massive capital expenditures that outpace current monetization. Remember artificial intelligence and technology equities drive a historic concentration in the U.S. stock market. Mega-cap tech and AI-linked firms account for roughly 40% of the S&P 500’s total market value.
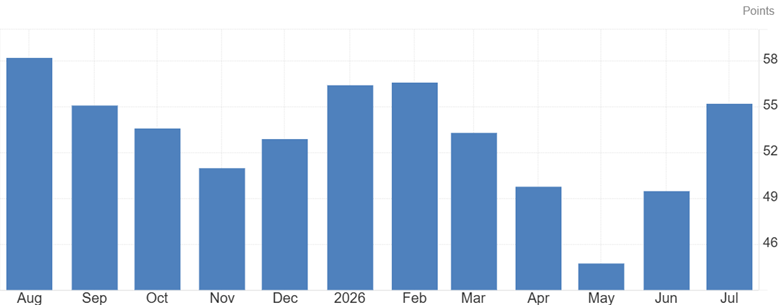
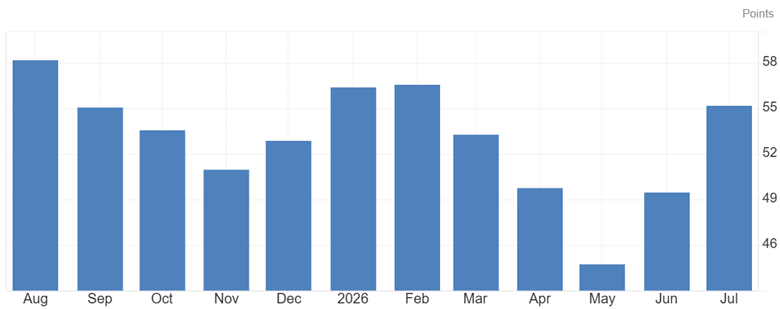
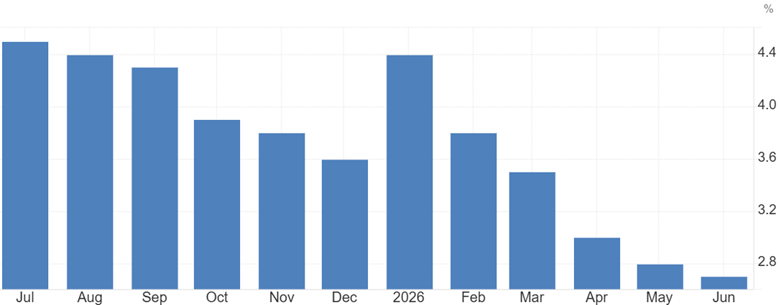
This linked to Conference Board Consumer Confidence Index is eye opening.
Gold buying
Since 2020, central banks have been prolific gold buyers, many years over 1,000 tonnes. In Q1 2026, central banks purchased a net 244 tonnes of gold, exceeding the five-year quarterly average and extending the strongest sovereign buying cycle since 1967.
At AOTH we believe gold ETFs will come back and they already have started.
Global gold ETFs experienced net inflows in July 2026, adding 23.5 tonnes valued at roughly US$3 billion, and reversing two consecutive months of heavy outflows recorded in May and June.
In Q1 2026 retail investors bought 474.0 tonnes of gold, the second highest quarter on record. Q2 2026 demand dropped off to 307.1 tonnes.
So, gold is already moving, central banks are buying, HNW individuals still have record wealth tied up in extremely liquid savings, top level corporate insiders have sold US$77 billion worth shares this year, the second-fastest selling pace in over 20 years, trailing only the stimulus-fueled peak of 2021 and gold ETF’s are starting to see inflows instead of outflows. The bottom 50% of retail households can buy paper gold, (ETF’s and gold focused equities) within retirement accounts.
Something wicked could be coming our way. Got some gold and silver?
Richard (Rick) Mills
aheadoftheherd.com

Legal Notice / Disclaimer
Ahead of the Herd newsletter, aheadoftheherd.com, hereafter known as AOTH.Please read the entire Disclaimer carefully before you use this website or read the newsletter. If you do not agree to all the AOTH/Richard Mills Disclaimer, do not access/read this website/newsletter/article, or any of its pages. By reading/using this AOTH/Richard Mills website/newsletter/article, and whether you actually read this Disclaimer, you are deemed to have accepted it.