Visualizing Future Solar Power Capacity by Country
By Bruno Venditti – Visual Capitalist
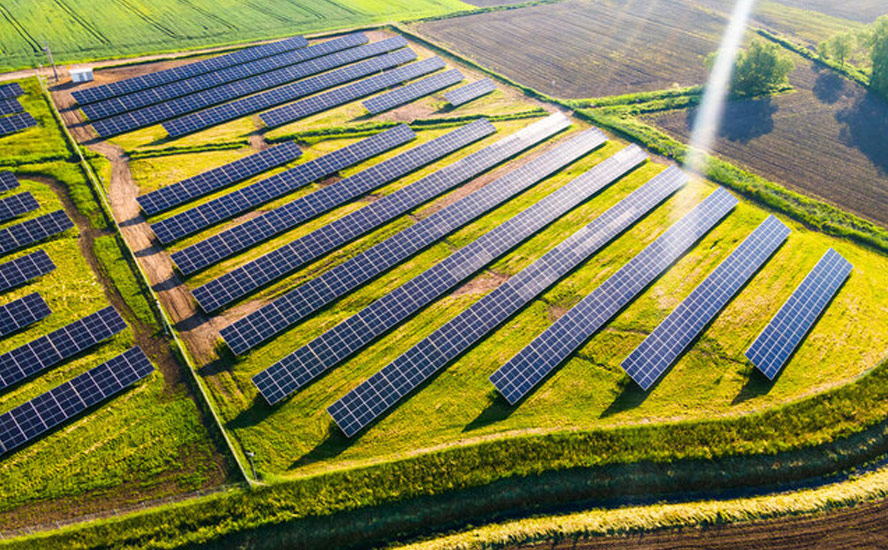
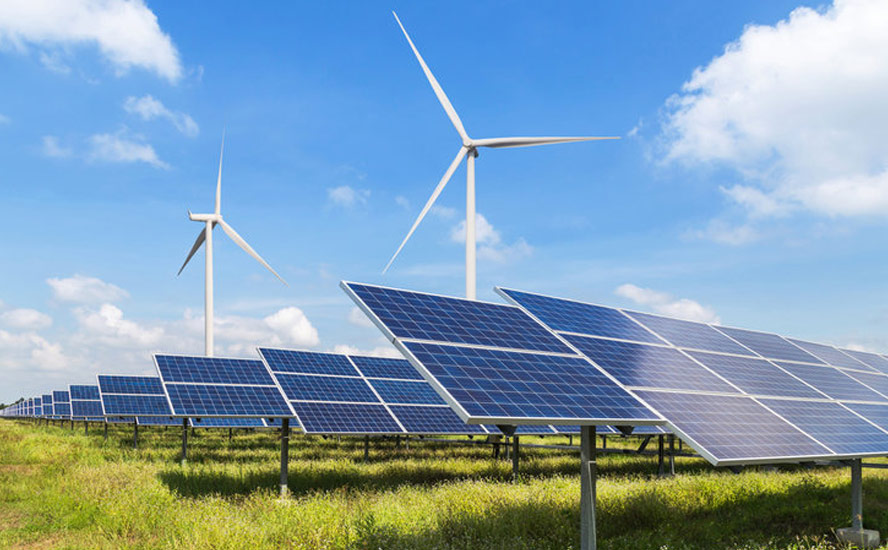
The global solar energy landscape is rapidly transforming as countries race to expand clean energy capacity. This visualization breaks down total solar power by country, combining both operational and prospective (planned) projects.
The data for this visualization comes from the Global Energy Monitor’s Solar Power Tracker. It compiles every known solar project around the world, measured in megawatts alternating current (MWac), a measure of how much usable electricity a solar farm delivers to the grid.
Legal Notice / Disclaimer
Ahead of the Herd newsletter, aheadoftheherd.com, hereafter known as AOTH.Please read the entire Disclaimer carefully before you use this website or read the newsletter. If you do not agree to all the AOTH/Richard Mills Disclaimer, do not access/read this website/newsletter/article, or any of its pages. By reading/using this AOTH/Richard Mills website/newsletter/article, and whether you actually read this Disclaimer, you are deemed to have accepted it.
Related posts


June 29, 2023


February 5, 2023


January 26, 2023


November 1, 2022
