Gold, silver and copper market updates, we’re bullish – Richard Mills
2026.04.22
Gold and silver have largely defied traditional safe-haven expectations during the 2026 Iran conflict, experiencing significant volatility and price declines rather than consistent rallies. Gold fell over 10% and silver over 20% in March 2026, often dropping when oil prices spiked as investors sold assets, including gold, for liquidity amid a stronger US dollar.
Copper prices have remained resilient during the war, often trading near record or multi-month highs due to tight supply-demand fundamentals. While the conflict initially caused volatility and supply chain disruption, prices have been supported by fears of production cuts in Africa and Latin America, partly driven by shortages of sulphur/ sulfuric acid used for leaching copper.
Gold
Bond yields rising
Gold has an inverse relationship with US Treasury yields. As yields rise, gold normally falls, as interest-bearing assets become more attractive compared to gold, which offers neither interest nor a dividend.
The opposite happens when yields fall, normally.
Like gold, Treasuries are a haven during geopolitical crises like the current war in the Middle East.
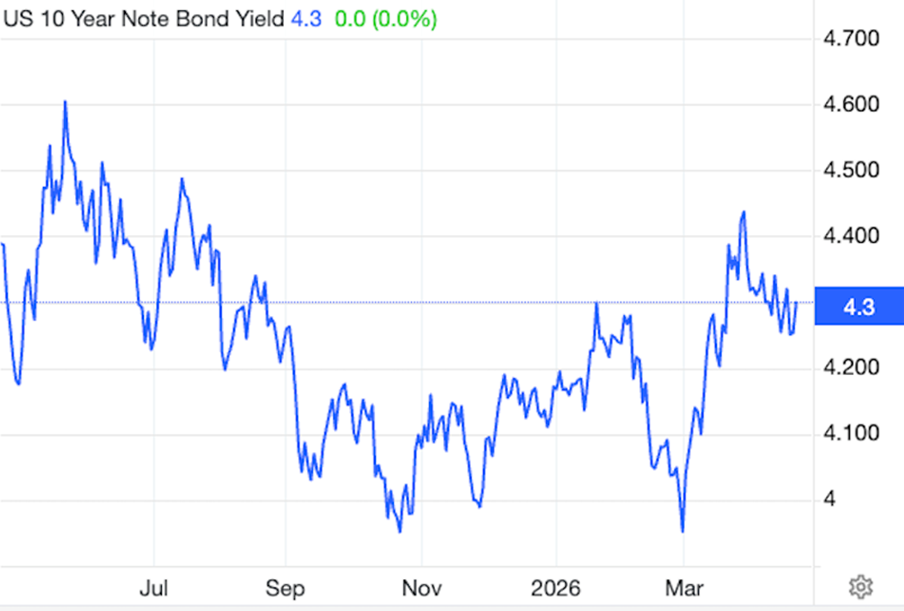
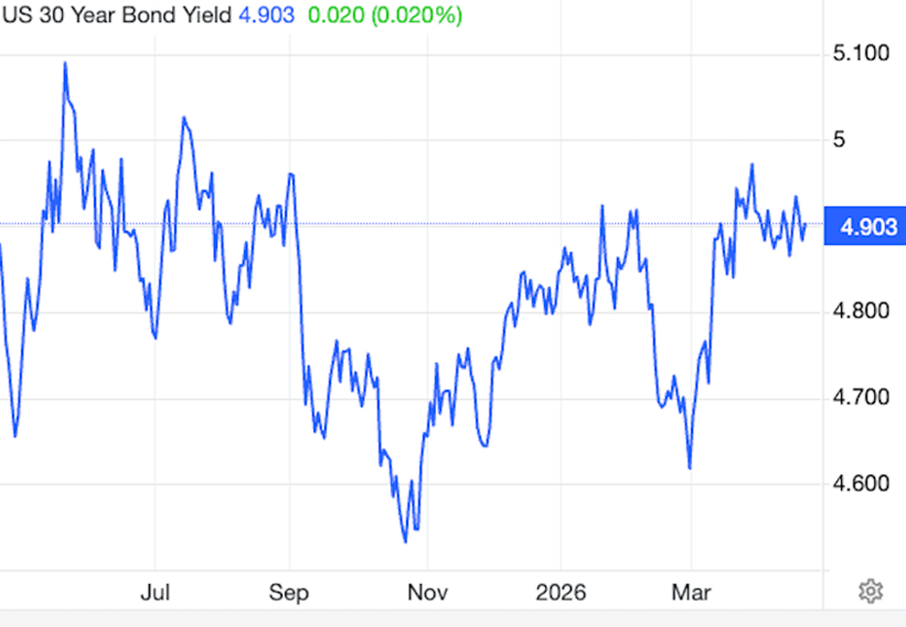
According to MSN, Treasury yields are surging as global buyers retreat from owning US debt (One more thing to understand about Treasuries: Prices and yields move in opposite directions. As demand for them falls, prices dip and yields rise. As demand rises, prices go up and yields fall).
MSN notes yields are climbing sharply as geopolitical tensions, a $1.9 trillion deficit, and waning foreign demand undermine their safe-haven status. China is selling Treasuries at rates unseen since 2008.
The resulting pressure threatens the dollar’s purchasing power, fuels inflation risks, and may force the Federal Reserve into controversial debt monetization (i.e. quantitative easing, where the Fed buys Treasuries by printing money, at the risk of massive inflation).
Noting that the Iran war closed the Strait of Hormuz and disrupted oil supplies, driving inflation higher, The New Republic says that crisis coincides with the Treasuries’ struggle to finance a $1.9 deficit without its usual base of foreign buyers.The result is a surge in yields as investors sell off Treasurys, reversing decades of safe-haven behavior during global crises.
The publication adds the erosion of the petrodollar paradigm and the weaponization of the SWIFT system have further alienated once-captive buyers. This shift suggests a longer-term weakening of the dollar’s role in global finance, with implications for US borrowing costs and fiscal stability.
However, Seeking Alpha observes that rising yields in Japanese and German bonds, hitting multi-decade highs, reflect a broader global inflation cycle that predates the Iran war. Economist Lakshman Achuthan warns that this upturn is driven by structural forces like commodity price increases from industrial growth, not just oil shocks. Such persistent inflation pressures could limit central banks’ ability to ease monetary policy, further straining bond markets worldwide.
The Fed’s response to rising bond yields carries high stakes. Investopedia posits that, if private credit markets fracture, the Federal Reserve may become the buyer of last resort, creating money to purchase Treasurys and enable bank bailouts. While this would stabilize finance capital, it would erode wages, savings, and the dollar’s credibility, risking domestic austerity and international debt crises. The Fed’s current wait-and-see stance reflects uncertainty over whether inflation spikes are temporary or entrenched.
Hedge against debt
Gold serves as a primary hedge against rising global debt and deficits, tending to perform strongly when governments run high deficits that risk currency debasement and inflation. As debt levels rise, investor confidence in fiat currencies dips, increasing gold’s appeal as a safe-haven asset with no counterparty risk.
Historically, high fiscal deficits and high debt-to-GDP ratios are strongly correlated with rising gold prices, particularly in the 1970s and from 2000 onwards.
As of early 2026, the trend of high deficits, particularly in the US, is seen as driving further long-term growth for gold.
Gold beats Treasuries
Central banks have increased gold reserves from 9% to 24% of total reserves since 2015, shifting away from US Treasuries due to mounting debt fears.
Last year, central bank gold reserves surpassed US Treasury reserve holdings, marking the first time this has happened since 1996. According to the World Gold Council, via Vaulted, central banks collectively own about 18% of all the gold ever mined, or 38,214 tons. This gold was worth $4.6 trillion on April 7, 2026, prices.
The chart below shows the total value of foreign treasury reserves vs. the total value of gold reserves held by central banks since 2010.
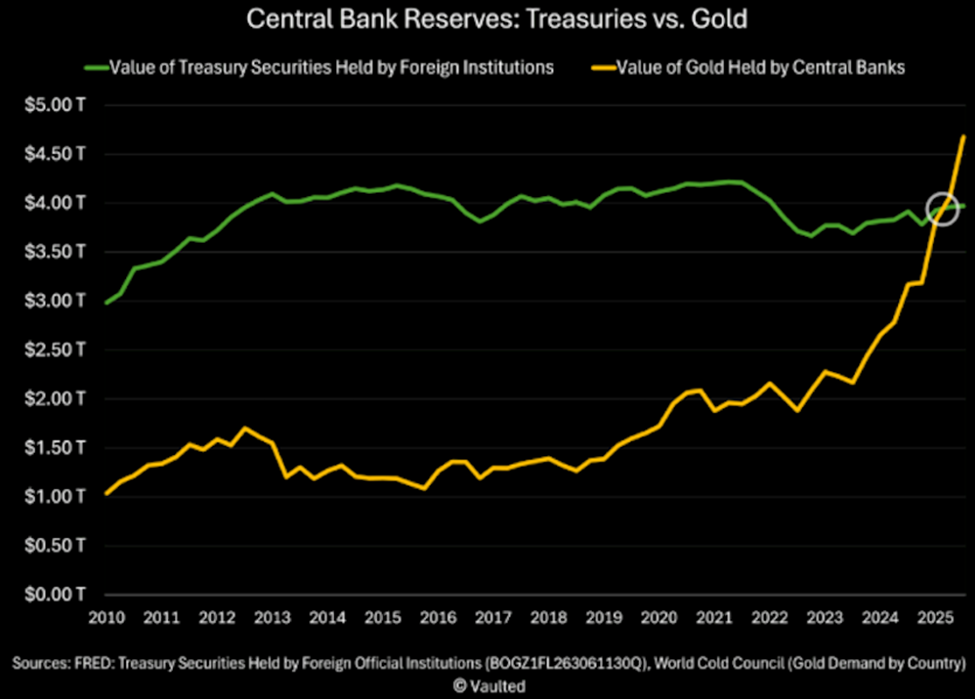
In the 2010s, Treasuries made up more than 30% of central bank reserves. That number has now dropped to 23%, while gold’s share has risen to 27%. In each of the last three years, central banks have collectively purchased over 1,000 tonnes of gold (double the annual average from the previous decade), states Vaulted.
Reasons for such high levels of central bank buying include post-pandemic inflation eroding confidence in the purchasing power of fiat currencies; the deterioration of US fiscal health — rising deficits are causing investors to worry about the country’s ability to manage its debt; gold is a neutral asset to settle transactions between nations, with no counterparty risk; Treasuries are vulnerable to sanctions; and gold has traditionally outperformed sovereign bonds and currencies during military conflicts and financial crises.
“Simply put: Treasuries come with strings attached. Gold does not.”
US gold-to-debt ratio falls to 2%
Despite the fact the United States owns the most gold of all nations, 8,133 tonnes, the amount of gold reserves held by the US Treasury as a proportion of government debt has shrunk to just 2%.
Discovery Alert notes this is one of the lowest ratios in 90 years and highlights a fundamental shift in America’s financial foundation:
The current 2% gold-to-debt ratio stands in stark contrast to America’s financial past. During World War II, US Treasury gold reserves accounted for approximately 40% of the nation’s debt, providing substantial backing to government obligations. By the 1970s, this ratio had declined but still maintained a relatively robust 17% of government debt…
As government debt approaches $40 trillion, the proportional backing of this debt with hard assets has diminished to historically low levels…
Significant gold accumulation by other nations, particularly China and Russia, has shifted the global balance of monetary power.
According to some analysts, China may have already surpassed US gold holdings, though official figures remain disputed…
Global central banks collectively own less than 20% of their total assets in gold—a significant decline from historical peaks of approximately 75% in the early 1980s…
Countries like Russia have increased their gold reserves substantially over the past decade, potentially positioning themselves for a monetary system less dependent on the US dollar.
Buy the dip
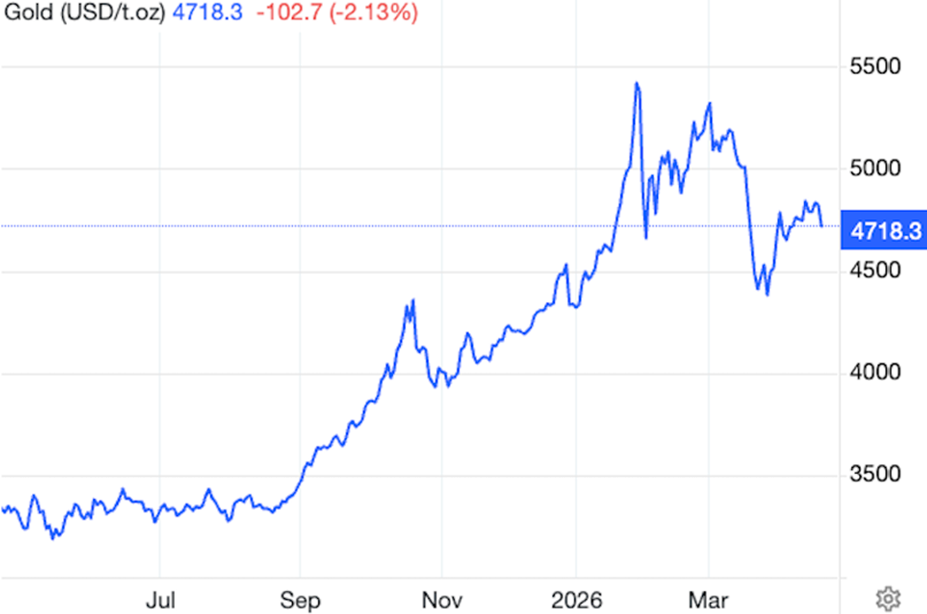
Gold’s pullback from a Jan. 28 record-high $5,589/oz has created an attractive entry point, said Barclays Bank analyst Aja Rajadhyaksha, via Investing.com. His justification is based on three reasons:
“The combination of geopolitical risk, persistent central bank buying, the inflation spike from the oil shock, and the fiscal effect of the conflict should all support gold,” he said.
Contrary to the mindset at the beginning of the conflict, Rajadhyaksha does not anticipate central bank interest rate hikes in 2026.
Another analyst quoted by Kitco News is also in the dip buyers’ club.
Nitesh Shah, head of commodities and macroeconomic research at WisdomTree, said the recent selloff — which has seen gold prices drop more than $1,000 from peak levels — appears largely disconnected from macroeconomic fundamentals and instead reflects a combination of positioning shifts and forced liquidations.
Shah added it’s not usual for gold to fall initially during geopolitical events before resuming its upward trend. Indeed, this is precisely what we see happening in the above spot gold chart.
Shah is skeptical that central banks will raise interest rates to combat inflation due to the risk of triggering a recession. He said persistent geopolitical tensions will remain a key pillar of support for gold prices.
Looking beyond gold, the analyst said the current environment is broadly supportive for commodities as a whole, particularly as the global economy moves into a late-cycle phase marked by rising inflation risks and supply constraints.
“Late-cycle economic dynamics tend to be positive for commodities,” he said, noting that energy, agriculture and base metals are now catching up after precious metals led the rally earlier in the cycle.
Turning to gold supply, an AI Overview says that mined gold production is currently failing to keep pace with demand, contributing to a structural deficit that is supported by high consumer demand, central bank buying, and dwindling reserves. While mine production reached a record high of 3,672 tonnes in 2025, total demand continues to outrun this supply, creating a long-term, tightening supply scenario.
According to the World Gold Council, 2024 mine production reached 3,661.2 tonnes, with gold demand hitting 4,974 tonnes. 4,974t of demand minus 3,661.2t of production left a deficit of 1,312.8t. Only by recycling 1,370 tonnes of gold jewelry could demand be satisfied.
This is our definition of peak gold. Will the gold mining industry be able to produce, or discover, enough gold, so that it’s able to meet demand without having to recycle jewelry? If the numbers reflect that, peak gold would be debunked. We’ve been tracking it since 2016, and it hasn’t happened yet. Global mined production has largely plateaued over the past five to seven years.
And while 2025 saw record gold production, mining faces a potential cliff after 2025 as the pipeline of large-scale projects shrinks.
Causes of the mined deficit includes dwindling reserves, a lack of new discoveries, declining ore quality, and resource nationalism. For example, Burkina Faso plans to increase its stake in the Kiaka gold mine from 15% to 40% via a government decree, it was recently reported.
Identified, economic gold reserves are estimated at only about 20 years’ worth of mining at current production rates (approx. 59,000 tonnes remaining), states The Oregon Group.
The industry is increasingly relying on junior explorers to fill the gap in finding new deposits. However, the long-term trend points towards a sustained tightening of gold supply due to geological scarcity and the long lead times required to bring new mines into production.
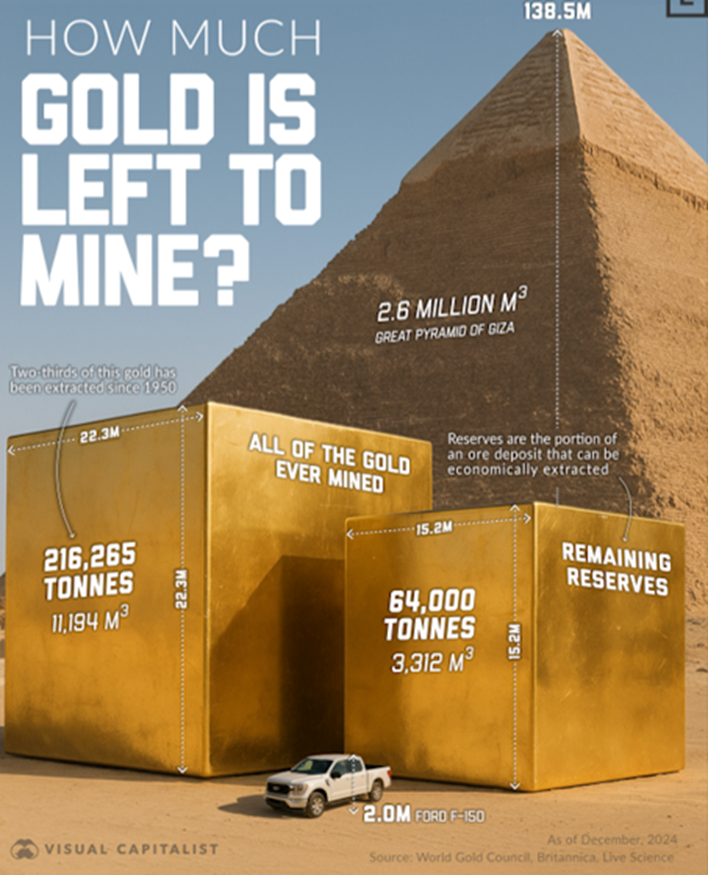
A November 2025 infographic finds roughly 216,000 tonnes of gold have been mined, with about 64,000t left underground.
One way major gold miners could increase their reserves without simply buying the reserves of other companies through M&A, which does nothing to increase global gold reserves, is for them to consolidate gold districts.
Newmont Mining (NYSE:NEM) for example significantly consolidated its gold district holdings in Nevada, most notably through the creation of Nevada Gold Mines (NGM), a joint venture with Barrick Mining (NYSE:ABX), and previously by acquiring major competitors.
More recently, Agnico Eagle Mines (NYSE:AEM) announced a plan to consolidate properties in the Central Lapland Greenstone Belt of northern Finland, through the 100% acquisition of Rupert Resources and Aurion Resources; and the purchase of a 70% interest in Fingold Ventures held by B2Gold (TSX:BTO).
Together with the 30% interest held by Aurion, the deal would result in Agnico Eagle owning a 100% ownership interest in the Fingold JV, and “would establish Finland as a multi-asset, multi-decade regional platform within Agnico Eagle’s portfolio, with a pathway to become an approximately 500,000-ounce annual gold production hub within the next decade,” AEM states.
Silver
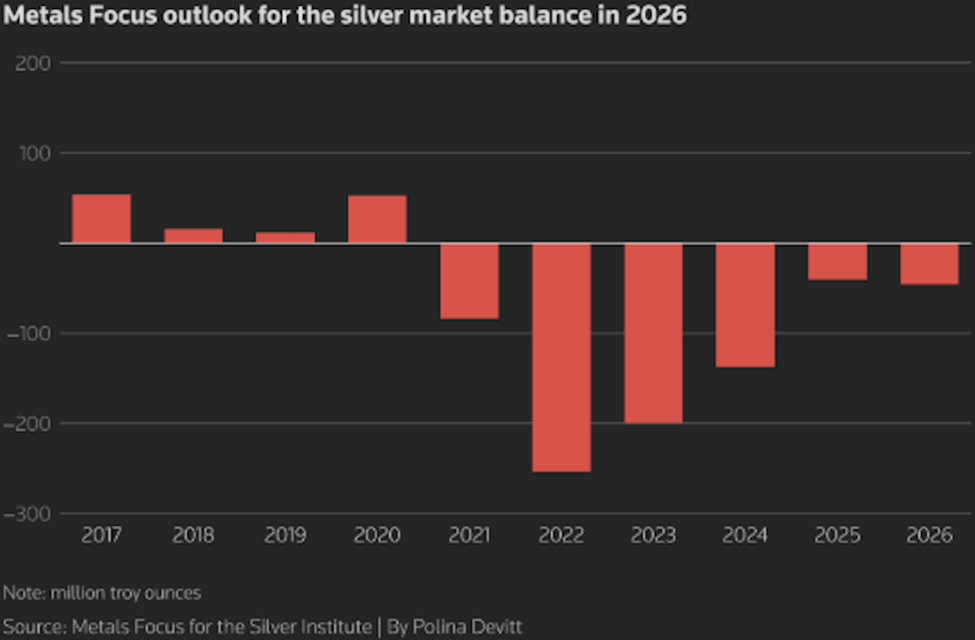
There is a significant, ongoing structural shortage of physical silver in 2026, marking six consecutive years of deficits where industrial and investment demand outweighs supply. While exchange-traded paper silver exists, physical silver is increasingly scarce, with major inventories in London, New York, and Shanghai experiencing rapid depletion.
Analysts estimate the cumulative supply deficit since 2021 at roughly 820 million ounces — nearly a full year of global mine production, gone. This year’s deficit is projected at 67Moz.
Record demand from industrial sectors, particularly solar panels, electronics and electric vehicles, is outpacing flat mine supply.
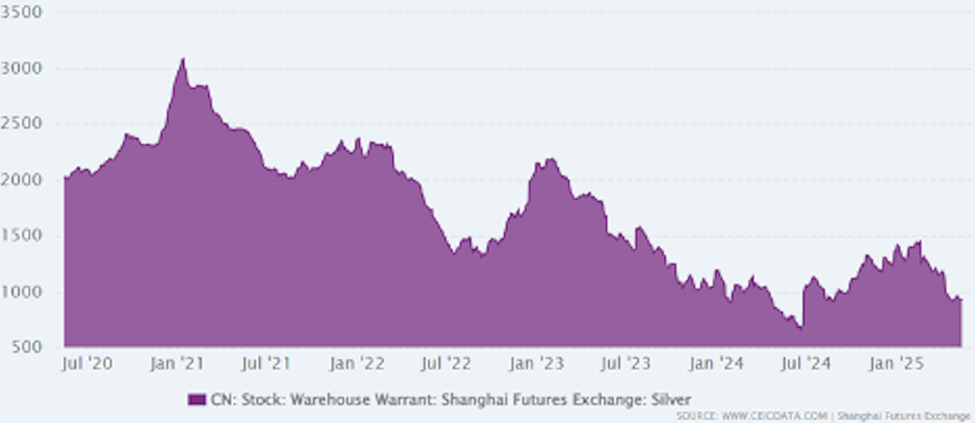
The three largest silver inventories (Shanghai, COMEX and LBMA) are dropping simultaneously, with nearly a billion ounces vanishing from visible stocks since 2021.
Strong demand has led to shortages in physical silver products (bars and coins) and tight supply in the physical market.
The silver shortage is real — Richard Mills
Behind the silver deficit
Key findings as of early 2026, by the Silver Institute:
- Because mine output and recycling combined still fail to meet demand, the gap is primarily filled by clearing out global exchange-traded products (ETPs) and COMEX warehouse stocks.
- The shortage is driven by record industrial demand — particularly in solar energy, electronics, and electric vehicles — colliding with stagnant mine supply of around a billion ounces.
- 70 to 75% of silver is produced as a byproduct of lead, zinc and copper mining, meaning miners can’t easily increase silver production in response to higher prices.
As for the 2026 outlook, Reuters reported last week that industrial demand for silver is seen down 3% to 640Moz, but coin and bar demand should rise by 18% to 258Moz.
The publication cites data from the Silver Institute and consultancy Metals Focus, which found that 762 million ounces have been drawn from inventories since 2021, raising the risk of a renewed liquidity squeeze despite weaker demand expectations.
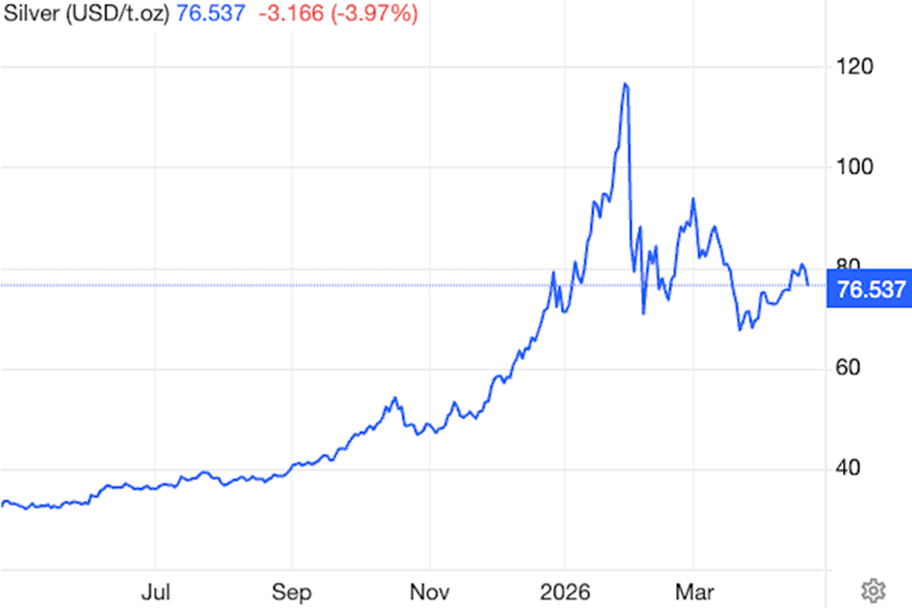
It notes silver used in jewelry, electronics, EVs, solar panels, and for investment, is down 35% following a 147% surge in 2025 and driving prices to a record-high $121 an ounce in January.
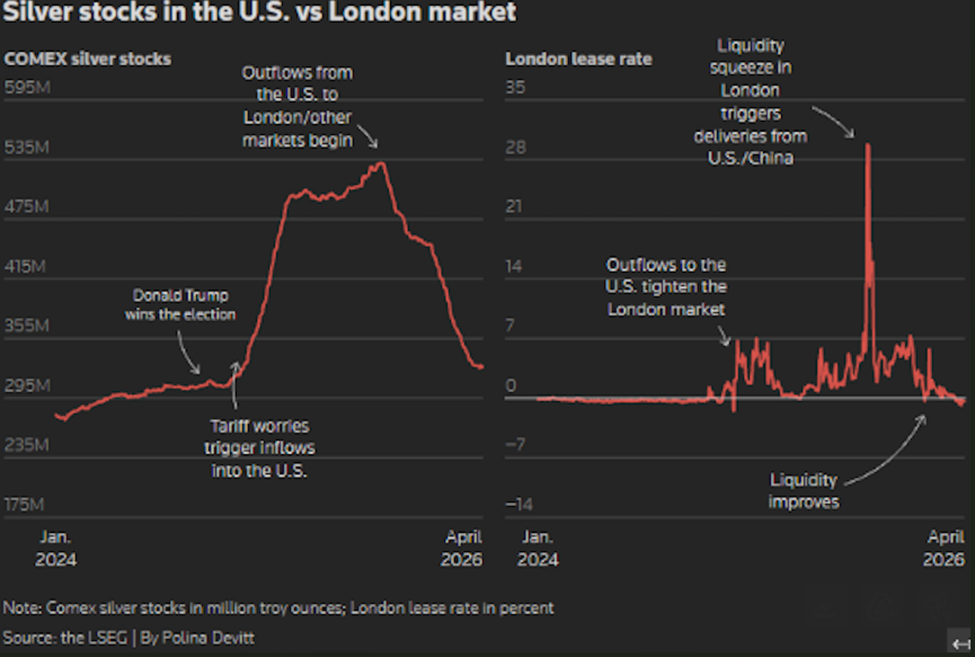
The downside of the 2025 silver run was an October liquidity squeeze in the benchmark London market, caused by months of inflows to US inventories and silver-backed exchange-traded products (ETPs), alongside a spike in physical demand.
While liquidity has improved as metal flowed back from the US, ETPs saw outflows and Indian demand eased, said Reuters, before quoting Philip Newman, managing director at Metals Focus, which prepared the research for the Silver Institute: “Lease rates in London have largely normalised, but risks of another liquidity squeeze this year remain.”
China
One can’t write intelligently about the silver market without mentioning China, the world’s largest silver consumer.
Beijing is reportedly pulling silver from global markets at the fastest pace in eight years.
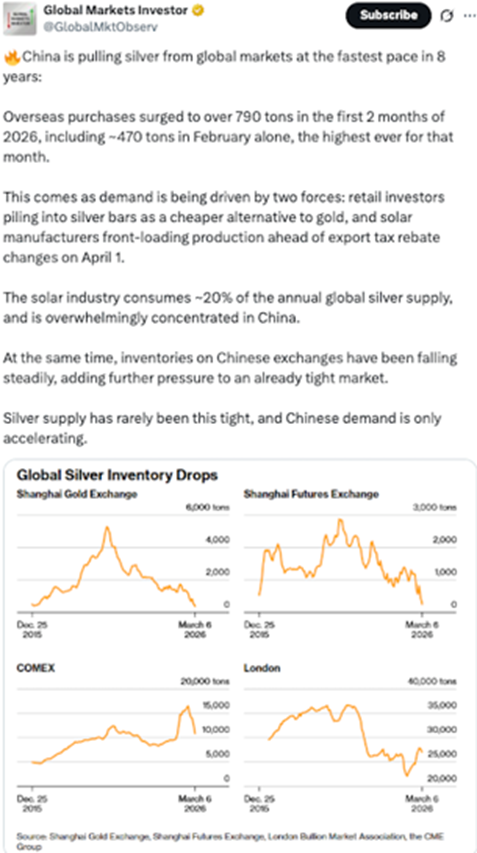
According to Bloomberg, China’s silver imports hit an all-time high in March, fueled by demand from retail investors and the solar industry. The month saw 836 tons cross China’s docks, compared with a 10-year seasonal average for March of about 306 tons.
Scrambling for high-grade ground
While silver is down about $40 from the January record high, the precious metal has been consolidating its gains in a band around $75 to $85 through the first four months of the year. (USA News Group).
The 150% year-on-year run has producers scrambling for high-grade ground. Past-producing ground that was uneconomic at silver below $20 per ounce a decade ago looks very different at $80.
Copper
The copper industry is entering a structural deficit, with demand from electrification and AI expected to outpace new mine development. Recycling is essential for filling this gap, but it is not currently capable of meeting the entire deficit on its own.
Why we’re running out of copper — Richard Mills
While the copper market was roughly balanced in 2025, meaning that refined production met consumption, mine supply was severely disrupted and will likely create a deficit in 2026, states the International Institute for Strategic Studies (IISS).
A significant long-term deficit is projected, potentially exceeding 6 million tonnes annually by the early 2030s. Total output from copper mines in 2025 was 23 million tonnes, according to the USGS.
A new study released on Jan. 8 by S&P Global Market Intelligence and S&P Global Energy found that copper supply is expected to fall 10Mt short of demand by 2040, putting at risk industries such as artificial intelligence, defense spending and electrification.
The shortage would be 23.8% shy of the projected demand of 42Mt, even as copper recycling doubles to 10Mt. AOTH research has found that copper supply has not been able to meet demand without recycling for the past several years.
“Here, in short, is the quandary: copper is the great enabler of electrification, but the accelerating pace of electrification is an increasing challenge for copper,” Daniel Yergin, vice chairman at S&P Global, who co-chaired the study, said in a statement. “Economic demand, grid expansion, renewable generation, AI computation, digital industries, electric vehicles and defense are scaling all at once — and supply is not on track to keep pace.”
An earlier (November 2025) blog post by Wood Mackenzie brings its forecast five years ahead of S&P Global, with the consultancy expecting global demand for copper to surge 24% and reach 43Mtpa by 2035.
It says four emerging demand disruptors will add 3Mtpa, almost doubling growth from traditional sectors. The four sectors underpinning a stronger outlook for the copper market are: the rapid expansion of data centers; geopolitical tensions ratcheting up spending on defense and boosting infrastructure resilience; low-carbon energy projects consuming record amounts of copper; and Southeast Asia and India becoming major consumers of copper as they rapidly industrialize.
Data centers: Gluttons for power, water and minerals Part I
Data centers: Gluttons for power, water and minerals Part II
Copper has been volatile for the duration of the now seven-week war in Iran, falling as low as $5.33/lb on March 20 before rebounding to the current $6.00 as investors stayed cautious ahead of further US-Iran peace negotiations.
Coming off four weeks of gains, the base metal fell 0.5% Monday to settle at $13,275/tonne ($6.02/lb) on the London Metal Exchange.
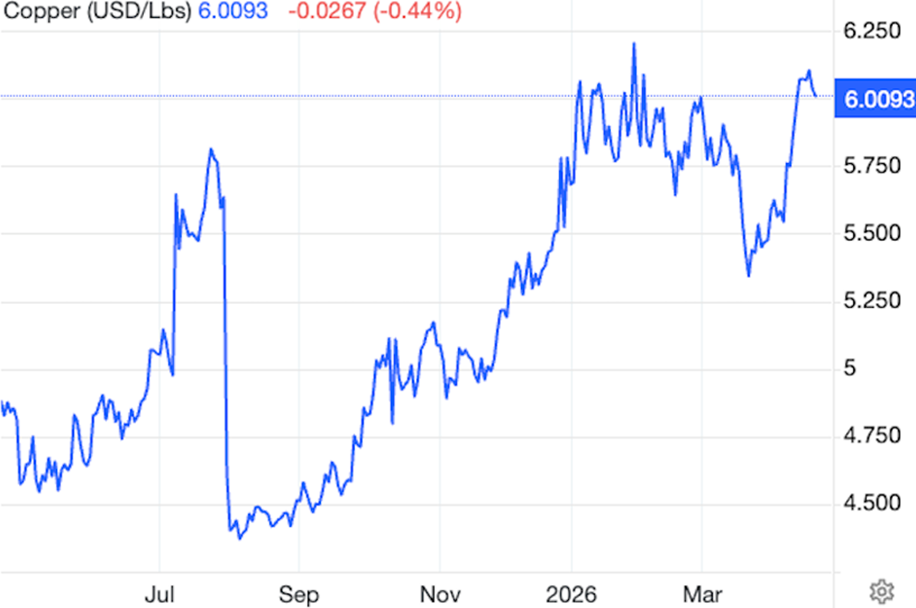
But prices are supported by improving demand sentiment in China and a sharp drawdown in exchange inventories: Shanghai Futures Exchange stockpiles are down nearly 200,000 tons since the March 13 peak.
According to the Financial Post, The major risk for metals is a prolonged closure of the [Hormuz] strait, which would magnify the energy shock already rippling through the world economy. That could force central bankers into a more hawkish stance, hitting global manufacturing and damaging demand for industrial commodities.
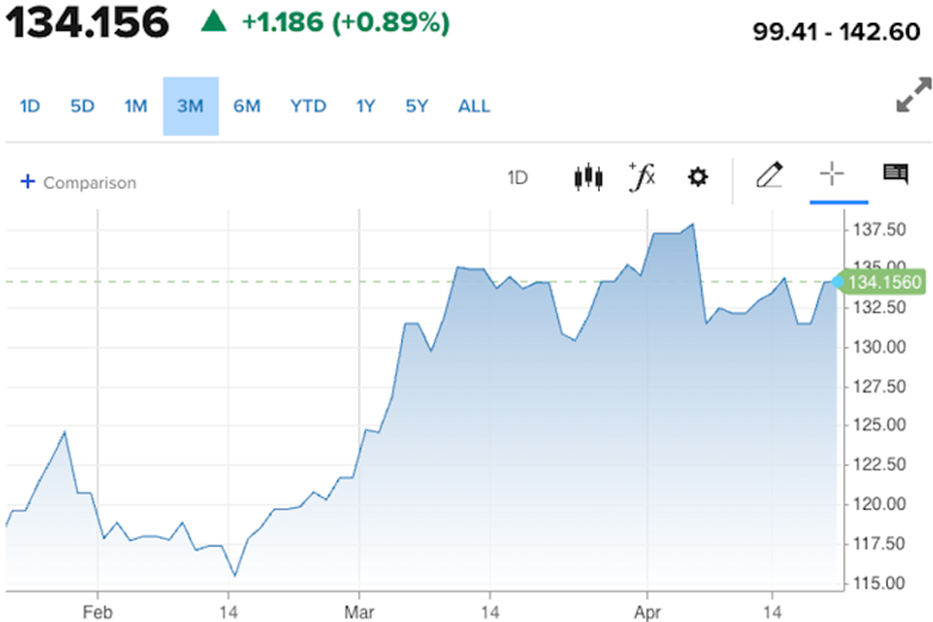
Tavi Costa, former principal at Crescat Capital, says “Copper has shown remarkable resilience despite the broader volatility across most commodities.”
For proof, check out the Bloomberg Commodity Index’s (BCOM) three-month chart.
Costa goes on to say in a post on X: “The metal precisely retested its breakout level, which now appears to be holding as strong support. In my view, this sets the stage for the next move higher. Both the technical and fundamental backdrop remain incredibly constructive.”
Like for silver, to understand the copper market we need to look at China, the world’s largest consumer of the ubiquitous industrial metal.
Earlier this month, a researcher at state-owned China Minmetals said Chinese refined copper consumption could grow by an average 3.7% annually through 2035. In the company’s “most realistic” scenario, that would mean 22.9 million tonnes, up 43% from 16Mt in 2025. (Kitco News)
In that scenario, China in 2035 would account for 55% of total refinery production of 29Mt in 2025, per the USGS.
China’s rising copper consumption comes at a time when copper refining is challenged due to the war in Iran.
Among the commodities the closure of the Strait of Hormuz has affected are sulfur and sulfuric acid.
According to Argus Media, Roughly half of global seaborne sulphur trade transits the strait of Hormuz. With Middle Eastern refinery operations disrupted and shipping largely halted, global sulphur availability has tightened sharply.
Sulfuric acid is a core reagent in the heap leaching and solvent extraction–electrowinning (SX/EW) process used to produce copper from oxide ores and certain secondary sulfide ores. This hydrometallurgical method is essential for the economic recovery of low‑grade deposits and is widely employed across major copper‑producing regions worldwide.
Sulfur chokepoint threatens critical minerals supply — Richard Mills
Heap-leach operations supply roughly one-fifth of the world’s refined copper, an amount approximating 4 million tonnes per year. According to the USGS, global refined copper production last year was 29 million tonnes, so heap leaching using sulfuric acid represents almost 14% of the total.
Sulfuric acid is a core reagent in the heap leaching and solvent extraction–electrowinning (SX/EW) process used to produce copper from oxide ores and certain secondary sulfide ores. This hydrometallurgical method is essential for the economic recovery of low‑grade deposits and is widely employed across major copper‑producing regions worldwide.
Heap-leach operations supply roughly one-fifth of the world’s refined copper, an amount approximating 4 million tonnes per year. According to the USGS, global refined copper production last year was 29 million tonnes, so heap leaching using sulfuric acid represents almost 14% of the total.
Among the top counties using sulfuric acid for copper leaching are the United States, Chile, Peru, Mexico, the Democratic Republic of Congo (DRC), Zambia, China, Kazakhstan and Australia.
Unsurprisingly, Chile is the top copper producer and the largest user of sulfuric acid for copper heap leaching, with a significant portion of its cathode production derived from solvent extraction and electrowinning (SX/EW), a two-stage hydrometallurgical process used to produce high-purity copper from oxide and low-grade ores.
Heap-leached cathodes account for roughly 40% of Chile’s total copper exports.
Ranked second in heap leach operations, the US uses large-scale heap and dump leaching in Arizona, including at the Morenci, Bagdad and Sierrita mines.
Peru, the third-biggest copper miner, uses hydrometallurgical processing, while Mexico operates several major heap leaching projects including Cananea.
China has invested heavily in heap leaching technologies for low-grade deposits and high-mud copper oxides, while Kazakhstan is active in in-situ leaching (ISL) for copper and uranium.
Australia uses bioleaching and heap leaching, for example at the Girilambone and Mount Leyshon mines.
Sulfur is used to make sulfuric acid used in African countries to heap leach copper. When these countries run out of sulfur/ acid they will no longer be able to extract copper, causing a shortage.
The Central African Copperbelt (CACB) produces around 6 million tonnes per year of sulfuric acid, much of which is used in the DRC — Africa’s largest copper miner — for high-grade oxide leaching.
Africa is particularly exposed to the war in Iran. According to Argus Media, nearly all sulfur imported by southern African buyers last year originated in the Middle East.
The CACB imports roughly 2Mt/yr of sulfur to make ~6Mt/yr of sulfuric acid for oxide copper leaching. An additional 2.5Mt/yr of acid is generated by regional copper smelters processing concentrates.
Argus notes Higher acid prices directly raise copper production costs in one of the world’s fastest-growing supply regions.
On April 15 Reuters ran with the headline ‘Congo copper and cobalt miners cut chemical use as Iran war disrupts supplies’.
A 2,000-tonne sodium metabisulfite (SMBS) order was canceled, while another 1,800-ton shipment was withdrawn earlier in April, despite contracts being signed, an anonymous source said.
An analyst at CRU, a consultancy, noted that premiums for sulfuric acid and SMGS shipped through Tanzanian port Dar es Salaam have almost doubled since the war began, raising costs for miners. Ship rerouting and freight availability have made the problem worse.
“What used to take you three months now takes you four, six months,” said mining chemicals supply-chain consultant Isabel Ramirez. “There is a heightened risk of shortages.”
With much of the world’s sulfur supply trapped in the Persian Gulf, sulfur prices have reached record highs — approaching 7,000 Chinese yuan per tonne on March 30 before slipping back to the current 5,950.
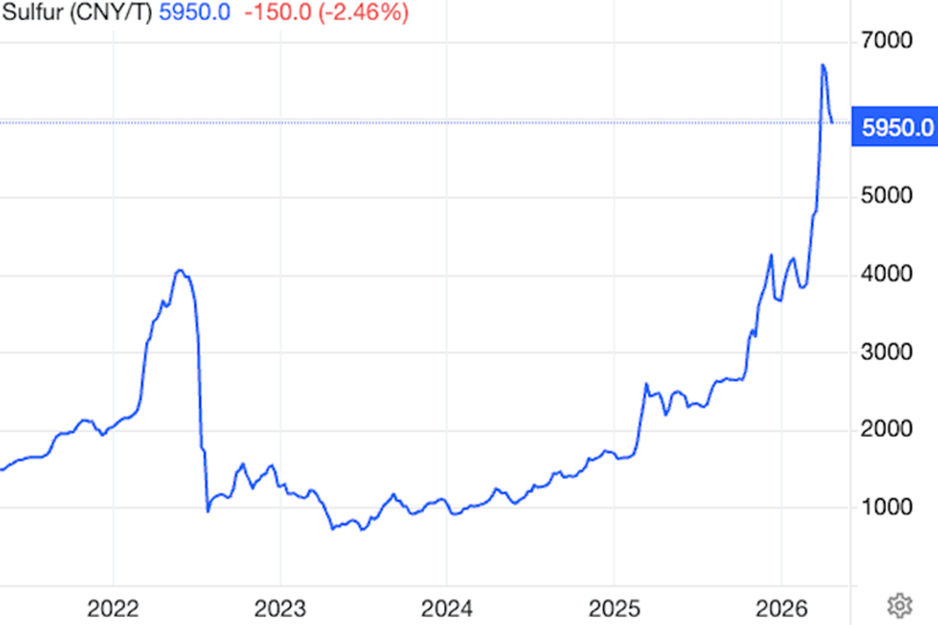
The sulfur supply squeeze has prompted China, the world’s largest sulfuric acid producer, to ban exports in May. Turkey has already done so and India is considering doing the same, said Argus via Reuters.
Blogger Robby Pontecorvo wrote in Medium on March 24 that pressure is building in copper processing because North America still doesn’t have enough refining capacity to handle its own output. All the copper produced in British Columbia, for example, is shipped to China for processing, with the end products sent back to us.
Why Canada and the United States need more smelters — Richard Mills
He further notes that demand is “layering”, with AI stacked on renewables which is stacked on EVs. Defense adds another layer.
Supply is much slower to respond, with a new copper project taking 7-10 years in the most optimistic scenario. Global estimates point to around 80 new mines needed by 2030.
So, you’ve got a market where demand is starting to lean forward, and supply is still locked into a slower cycle. That mismatch doesn’t show up immediately in price. It shows up in how tight things feel at the margins.
Lately, major copper miners are trying to fix the supply problem through mergers and acquisitions. We saw this for example through Anglo American’s (LSE:AAL) $54 billion merger with Teck Resources.
The problem, writes George Hay, a columnist for Reuters, is that despite near-record copper prices, they aren’t high enough to induce mass production. That’s because inflation has pushed up production costs even faster.
The IEA reckons that the capital expenditure required to get new supply up and running in Latin America, the world’s key production location, has increased by 65% since 2020. That’s the case even on “brownfield” sites…
To make an acceptable return on such a site, big miners would require a copper price of over $12,000 per ton, according to one mining investor. Throw in the fact that it takes 17 years to get a mine from discovery to production, and that permitting is getting harder, and it’s easy to see why bosses are generally reluctant to put much more money in the ground.
But there is one group of mining companies that is eager to explore for the next big discovery, and that is copper juniors. Remember, juniors own the mineral deposits that will become the next mines.
Last week Mining.com reported that exploration spending in British Columbia — the nexus of copper production in Canada, and where numerous copper-gold and copper-molybdenum deposits are yet to be developed — set a new record last year:
Exploration and evaluation expenditures in the province hit C$751 million ($548 million) in 2025, a 36% increase from 2024, according to the latest British Columbia mineral and coal exploration survey released this week by the EY consulting firm…
Copper’s emergence as BC’s top exploration target – a first – drove the increase in activity. Spending on the red metal climbed to C$384 million, accounting for just over half of total exploration investment and surpassing gold, long the dominant focus in BC.
The shift reflects growing confidence in long-term copper demand tied to electrification, infrastructure buildout and the energy transition, as well as the province’s endowment of large porphyry systems.
Conclusion
The war in Iran has not resulted in a spike in gold and silver prices, contrary to conventional wisdom that precious metals are a safe haven in times of extreme geopolitical tension.
For gold, this is primarily due to rising Treasury yields. Bond prices are dropping and yields are climbing because foreign investors are hesitant to buy US government bonds because of high debt levels. The trend of high US deficits is seen as driving further long-term growth for gold.
Central bank buying continues to underpin gold prices. Last year, central bank gold reserves surpassed US Treasury reserve holdings, marking the first time this has happened since 1996.
Mined gold production is currently failing to keep pace with demand, contributing to a structural deficit that is supported by high consumer demand, central bank buying and dwindling reserves.
Analysts do not believe central banks will raise interest rates to quell inflation driven by high oil prices; this removes a major risk to gold prices. Of course, the longer the war goes on, and the higher inflation climbs, the preferred monetary course of action could change.
Silver is entering its sixth year of deficits. Record demand from industrial sectors, particularly solar panels, electronics and electric vehicles, is outpacing flat mine supply.
The three largest silver inventories (Shanghai, COMEX and LBMA) are dropping simultaneously, with nearly a billion ounces vanishing from visible stocks since 2021.
Silver demand has rarely been this tight, and Chinese demand is only accelerating. China’s silver imports hit an all-time high in March, fueled by demand from retail investors and the solar industry.
Copper mine supply was severely disrupted last year and will likely create a deficit in 2026. A significant long-term deficit is projected, potentially exceeding 6 million tonnes annually by the early 2030s.
The bull case for copper is bolstered by tight markets for sulfur and sulfuric acid, the latter used in metals refining.
When copper-mining countries such as Chile, Peru, Australia, and those in the Central African Copperbelt run out of sulfuric acid they will no longer be able to extract copper, causing a shortage of refined copper.
China will ban exports of sulfuric acid on May 1, Turkey has already banned the reagent and India is considering it.
Major mining companies are trying to address the copper supply problem through M&A, but this does nothing to increase the total supply; it just transfers the reserves from the acquiree to the acquirer.
Despite near-record copper prices, they aren’t high enough to induce mass copper production. That’s because inflation has pushed up production costs even faster.
The threshold necessary to justify construction cost is currently pegged at $5.50 to $6.50/lb.
Our analysis of gold, silver and copper shows that Nitesh Shah, head of commodities and macroeconomic research atWidomTree, is right when he says that the current environment is broadly supportive of commodities, particularly as the global economy moves into a late-cycle phase marked by rising inflation risks and supply constraints.
Richard (Rick) Mills
aheadoftheherd.com

Legal Notice / Disclaimer
Ahead of the Herd newsletter, aheadoftheherd.com, hereafter known as AOTH.Please read the entire Disclaimer carefully before you use this website or read the newsletter. If you do not agree to all the AOTH/Richard Mills Disclaimer, do not access/read this website/newsletter/article, or any of its pages. By reading/using this AOTH/Richard Mills website/newsletter/article, and whether you actually read this Disclaimer, you are deemed to have accepted it.