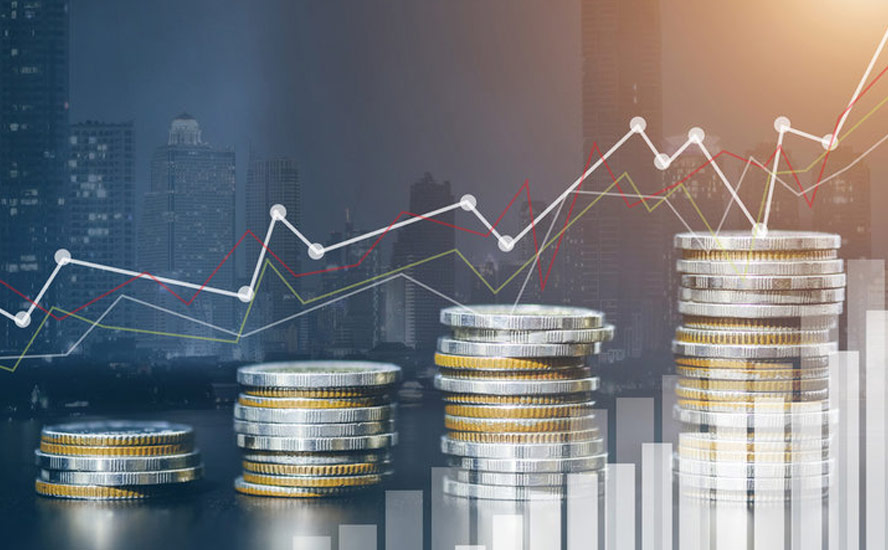
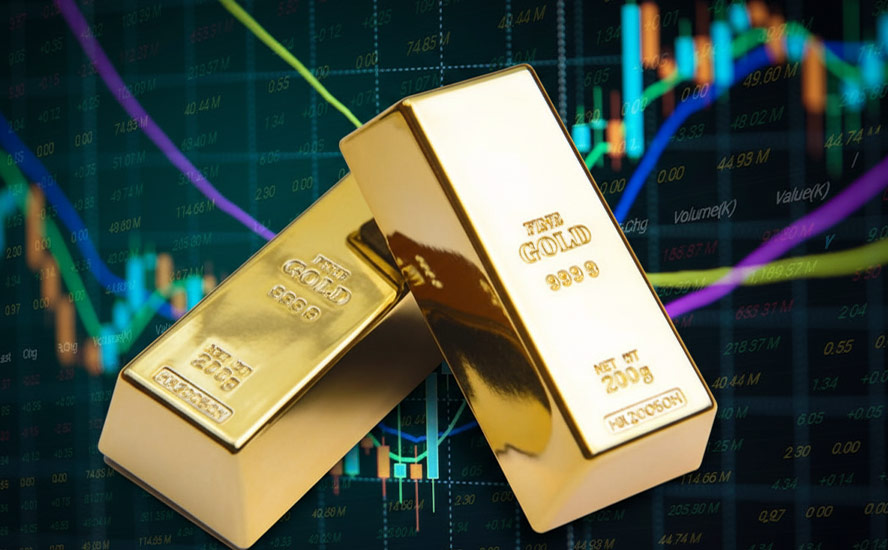
Silver gets its mojo back amid record demand and structural supply deficit – Richard Mills
2026.05.16
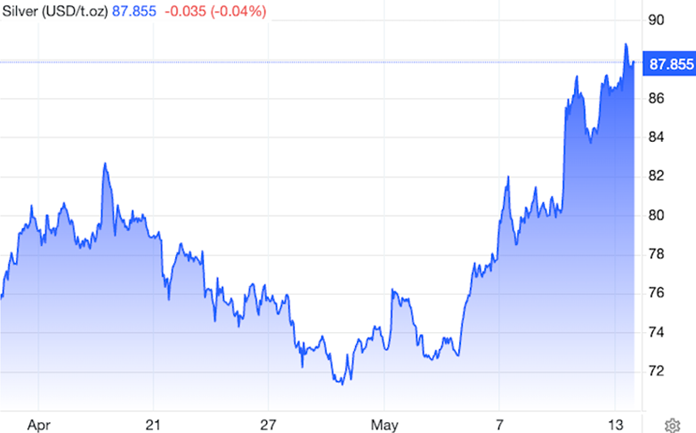
Spot silver hit $89 an ounce on Wednesday for a two month-high, outperforming gold which fell for a second straight session.
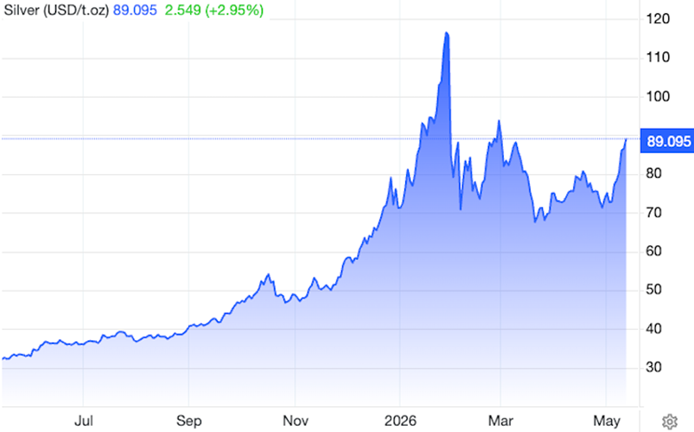
Silver appears to be making a comeback after dropping 36% on Jan. 30, its biggest one-day fall on record.
Looking at a one-month chart, spot silver has rocketed from $72.32 on May 5 to its current $87.85, a gain of 21%.
The war in Iran has not led to the expected safe-haven effects on gold and silver prices.
Instead, rising oil prices pushed the dollar higher. That, along with the prospect of higher interest rates, dragged silver down to a three-month low of $60.94 in March, and 50% from its all-time high of $121.64 reached on Jan. 29.
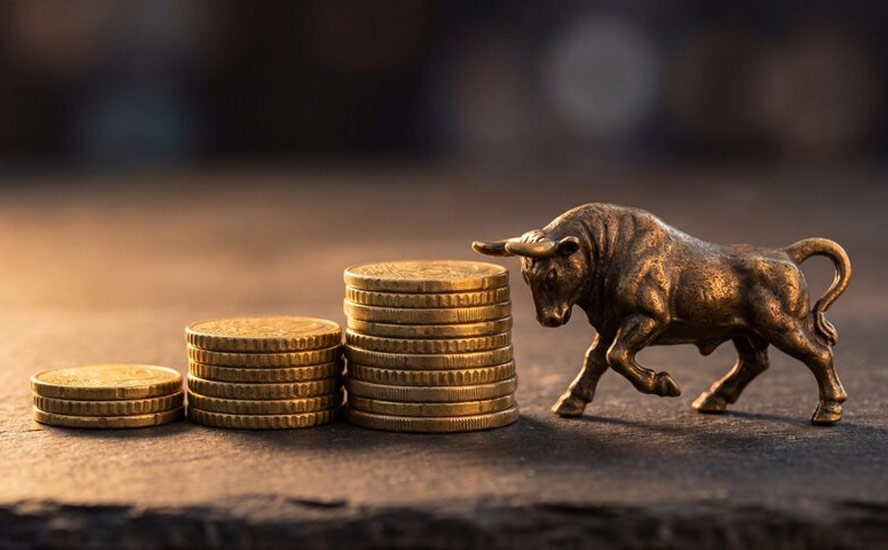
Silver surged by a whopping 135% in 2025.
Silver’s bull run
How to explain silver’s 2025 and recent success?
As the Silver Institute explains, via Money Metals, it was a combination of factors, including tight liquidity, growing investor interest and most importantly, a shortage of physical metal.
“Exceptionally strong physical demand, tight inventories, and robust industrial metal prices, copper in particular, fueled silver’s outperformance of gold during that period. This trend eventually became self-fulfilling, as investors that had previously favored gold shifted their attention to the white metal.”
Silver’s deficit finally caught up with it, as lower inventories and metal being pulled out of London or tied up in exchange-traded products (ETPs) created explosive conditions for lease rates and prices.”
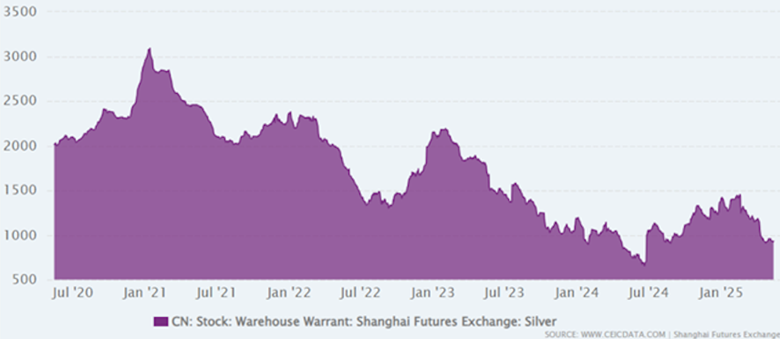
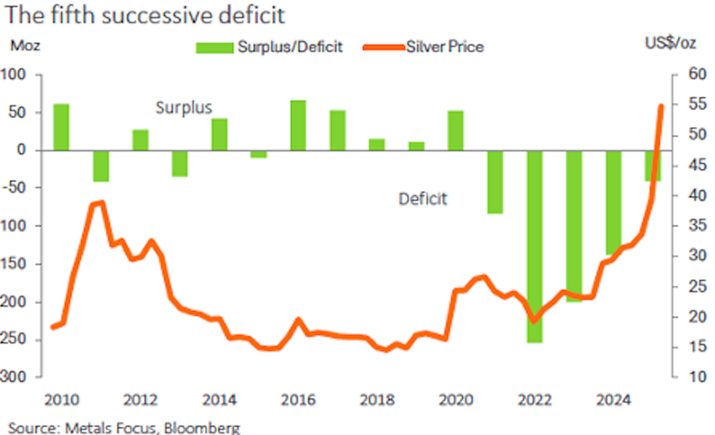
There is a significant ongoing structural shortage of physical silver in 2026, marking six consecutive years of deficits where industrial and investment demand outweighs supply. While exchange-traded paper silver exists, physical silver is increasingly scarce, with major inventories in London, New York, and Shanghai experiencing rapid depletion.
Analysts estimate the cumulative supply deficit since 2021 at roughly 820 million ounces — nearly a full year of global mine production, gone.
Metals Focus forecasts a 46.3-million-ounce deficit this year.
The silver shortage is real — Richard Mills
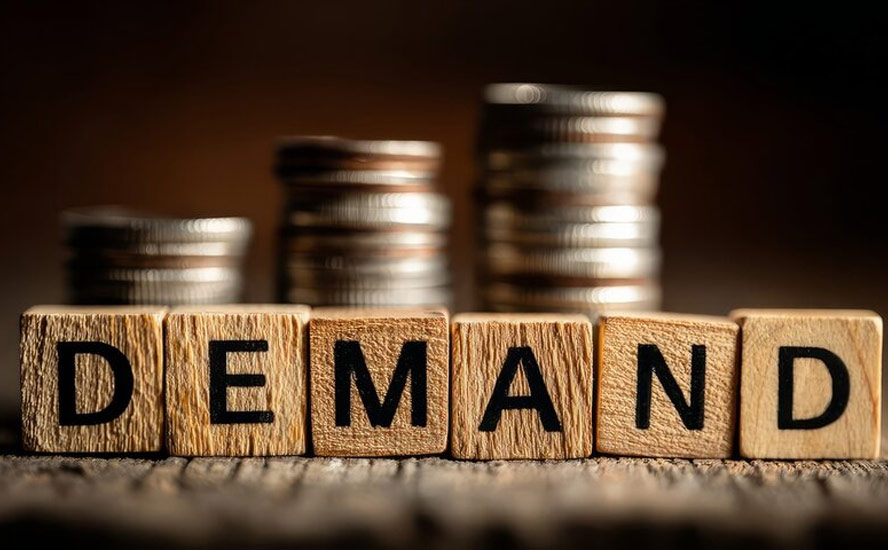
Record demand from industrial sectors, particularly solar panels, electronics and electric vehicles, is outpacing flat mine supply.
The three largest silver inventories (Shanghai, COMEX, and LBMA) are dropping simultaneously, with nearly a billion ounces vanishing from visible stocks since 2021.
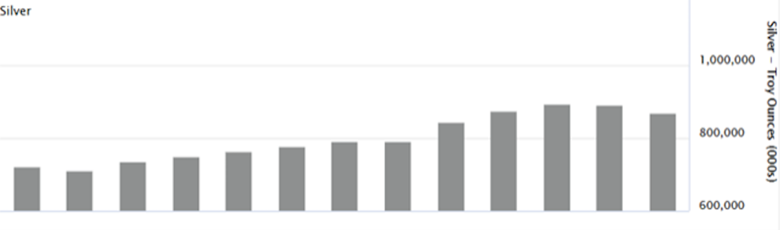
Strong demand has led to shortages in physical silver products (bars and coins) and tight supply in the physical market.
Money Metals says that silver moving out of the US has helped ease market tightness, but the ongoing structural supply deficit makes the metal vulnerable to future squeezes. The Silver Institute agrees, stating:
“Policy uncertainty remains unusually high, sovereign debt fears are, if anything, worsening in the face of war-related fiscal pressures, and concerns about the future role of the U.S. currency also remain relevant. The Iran war has complicated the short-term outlook, but in our view, on balance, strengthens the longer-term case for precious metals. Our base case is that the situation will be contained, and that the recent pressure that rising U.S. rate expectations have placed on precious metals prices will be temporary.”
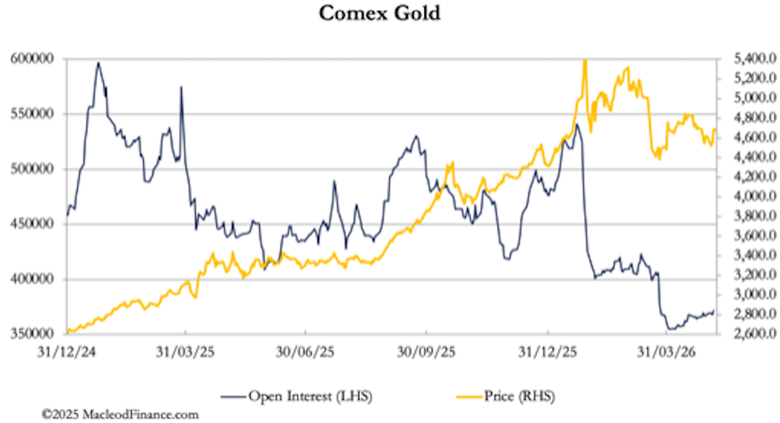
Precious metals analyst Alasdair Macleod thinks the likelihood of the silver bull market returning is strengthened, particularly given gold’s improving prospects.
Macleod notes that, “despite the collapse in [gold] open interest, the price has held up exceptionally well,” as the chart below shows.
(According to the World Gold Council, open interest in gold represents the total number of outstanding futures or options contracts that have not yet been settled or closed out at the end of the trading day. It acts as a key indicator of liquidity and gauges the flow of capital entering or exiting the gold derivatives market.)
The Comex silver contract is exhibiting similar conditions.
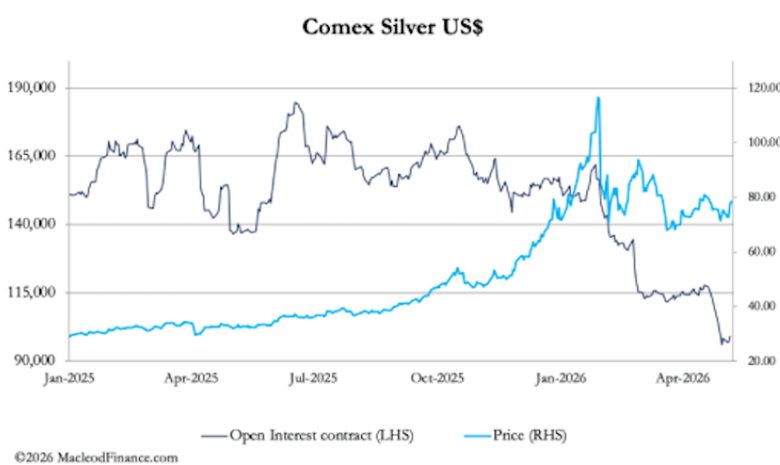
Macleod believes “short-term uncertainty is now entirely due to the fog of war… But the more we look at gold and silver, they resist going materially lower”:
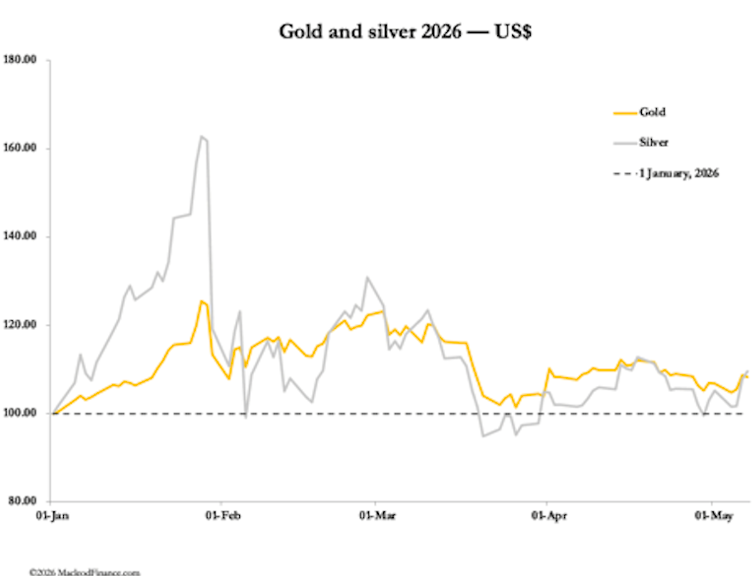
As noted above, there is a firmer underlying feel to these markets, and they appear ready to resume their intermediate upward trends.
In the case of gold, it is all about paper currency debasement, confirmed by the strength in other key commodities, notably copper which is hitting all-time highs. This is also true of silver, but there are additional bullish factors in this case to keep in mind.
Non-cyclical industrial demand for silver is still growing strongly, with photovoltaics leading the way followed by electric vehicle and military applications. Indian demand is particularly strong.
We’ll get into silver industrial demand in detail below, but first, a couple of other things from Macleod need mentioning. First, China’s net silver imports have jumped in recent months, putting further strain on global liquidity during a time of persistent supply deficits.
Second, China is now restricting silver exports, becoming a net buyer. That’s important because China is the second largest global source of mined and processed silver. Macleod writes:
And it didn’t help when last year, the US belatedly decided to declare silver a critical mineral, signalling that she would be in the market to accumulate a strategic stockpile. China won’t want to gift silver to the Americans, which is a further reason for her to restrict exports.
Last week market watchers told CNBC that the rally in gold and silver could resume if a peace deal in the Iran war is reached.
Phillippe Gijsels, chief strategy officer at BNP Paribas Fortis, a bank, says precious metals are now recovering with equities.
“We expect the secular bull market in gold and silver to resume and the metals to reach new all-time highs in the not too distant future, potentially this year,” he said, adding that all the elements that have brought gold and silver this far “are still very much in place.”
“Central banks and governments will continue to diversify away from U.S. government paper into gold,” he told CNBC. “As we live in an environment of structurally higher inflation one needs to hold real assets. Precious metals are clearly part of this. [And] as the fog of war lifts, investors will come back into the market for gold and silver.”
He argued the decline in gold and silver in recent months was “not the end, but merely a pause in what will live up to be the strongest and longest bull market in gold and silver in history.”
Like Gijsels, Paul Williams, managing director of gold and silver supplier Solomon Global, said silver prices were still underpinned by the same fundamental drivers that fueled the 2025 rally. In an email to CNBC he stated:
“Supply of physical silver remains tight, while strong demand from green technologies continues,” he said. “The U.S.-Iran conflict has only underscored the strategic case for solar power. AI-related demand remains significant and is growing, adding further pressure to an already stretched supply/demand balance.”
A May 13 piece by Kitco News is headlined ‘Silver Price Sees Solid Momentum and $90 Could Be Just The Start’.
The article arrives at this conclusion by noting that persistent industrial demand continues to outpace supply, and that silver’s industrial profile is starting to overshadow its role as an important monetary asset.
Julia Khandoshko, CEO of the European broker Mind Money, said the ongoing energy crisis caused by the war in Iran will create further demand for alternative energy, and silver is a critical metal needed for renewable energy, as well as new electric cars.
Despite some volatility in the market, Khandoshko said that silver remains in a phase of long-term growth.
“Silver is increasingly being driven by more than just investor sentiment, with supply constraints, logistics disruptions, and green-energy demand all shaping the market,” she said.
Technical analysis
Kitco’s article quotes a market analyst at OANDA, a financial services company, saying that in its current environment, silver has room to test resistance at $90 an ounce.
Another market analyst said if prices break above $90, traders and investors could start targeting January’s record highs at $120/oz.
“The daily MACD has turned up sharply, suggesting an increase in upside momentum,” said David Morrison with Trade Nation.
Christopher Romano, a market analyst with Reuters, wrote that “over the last six weeks, silver has risen back above two key technical analysis levels, called downtrend lines. Downtrend lines are diagonal lines connecting highs and are used to define a trend. Rising above a downtrend line indicates weakening of a downward trend.”
Romano says the most recent break of a downward trend occurred on May 6th and was part of a three-day surge that pushed silver up almost to April’s high of $83.04. He sees resistance at $82-83.
Surpassing the April peak on a sustainable basis would indicate that silver has secured a foothold in a higher range and increase market expectations that it could climb to $90…
However, if silver fails to surpass April’s peak, it would reinforce the trend of lower highs and could lead market participants to expect more losses, particularly if it were to fall below the area around $70.00-$71.00.
The historical silver chart below shows a cup and handle breakout pattern, which is appropriate for the well-known adage in stock market technical analysis, “The longer the base the higher in space.”
It means that when an asset spends a long period moving sideways in a “base” (coiling or consolidating) rather than rising, it is building up immense momentum. (Highcroft Investment Advisors)
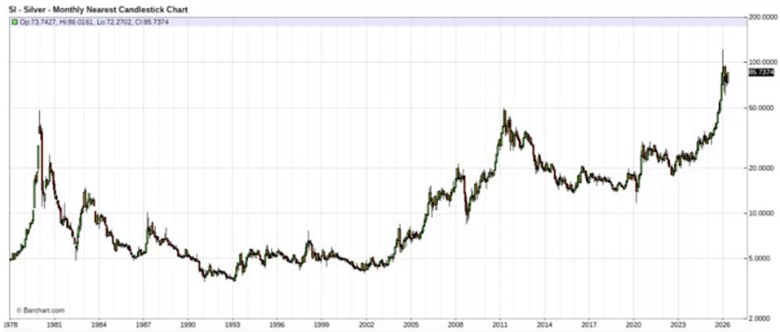
According to Sprott Money, silver could even blow past the $100 mark this year, reasoning that May will be the eighth consecutive month of $50+ silver prices. The last two times silver approached $50, the metal hit then-record highs, seen as the two peaks in 1980 and 2011 above.
The blog’s author says the chances that the silver price is headed up and towards a break of $95 “have increased greatly over the past week,” given the two red trend arrows marked in the chart below.
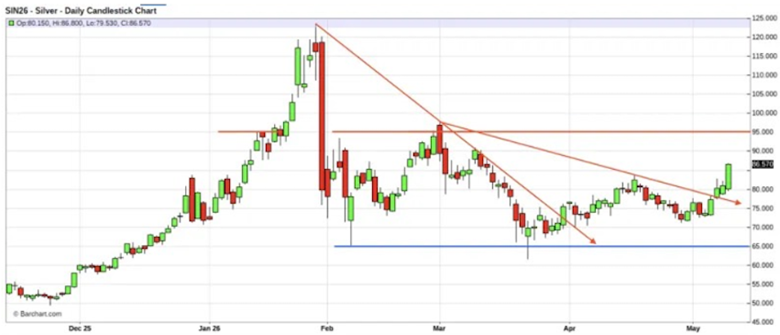
Will it break out when it gets there or will it fall back and need to regenerate some momentum for another attempt later this summer or autumn? That will depend upon the headlines, of course, but it may also be influenced by monetary policy in the U.S. as Kevin Warsh assumes the mantle at the Federal Reserve.
Either way, the silver price appears poised to break out above $95 sometime soon, and when it does, the rally “within the candle” of January 30 should allow it to quickly move back toward the all-time highs set about 100 days ago.
Monetary demand
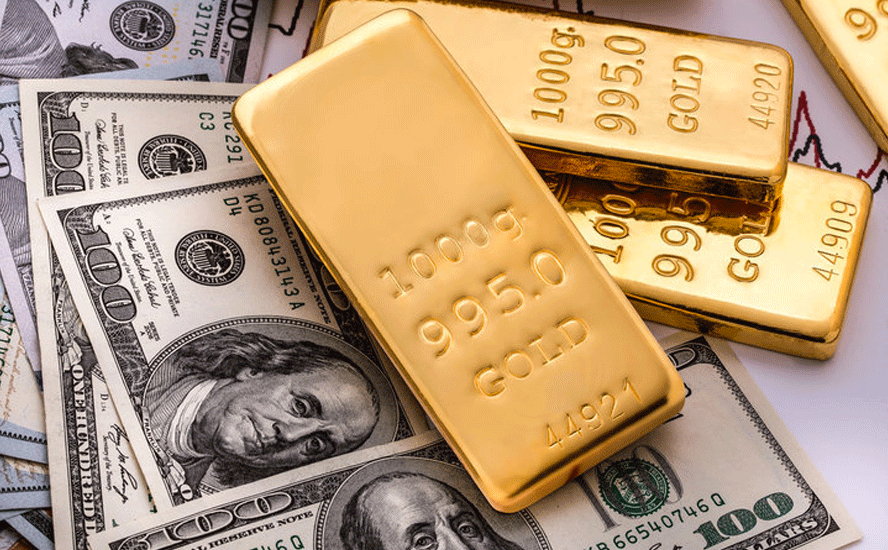
Unlike other industrial metals, physical silver (bullion, coins, and bars) is owned by individuals and central banks as an alternative to paper currency.
Investors historically flock to physical silver during periods of high inflation or lower purchasing power, as hard assets inherently retain more value than fiat.
During periods of geopolitical or macroeconomic stress, silver serves as a tangible asset that exists outside the traditional digital or paper financial systems. (The Royal Canadian Mint)
According to Alasdair Macleod, the above-cited precious metals analyst,
The emerging crisis for the dollar’s value, signalled by gold and commodity prices, generally will inevitably lead to additional investor demand, particularly from populous Asian nations seeing silver as an affordable alternative to gold. The combination of increasing industrial and rising investor demand points to far higher prices, with silver outperforming gold on the upside.
Long-term Treasury yields pushing 5% are also weighing on precious metals.
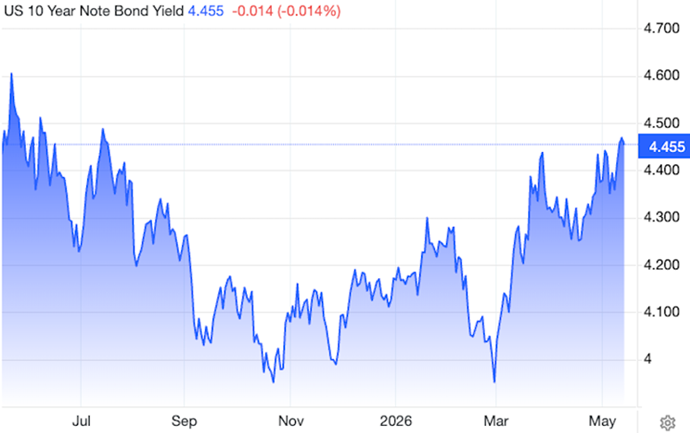
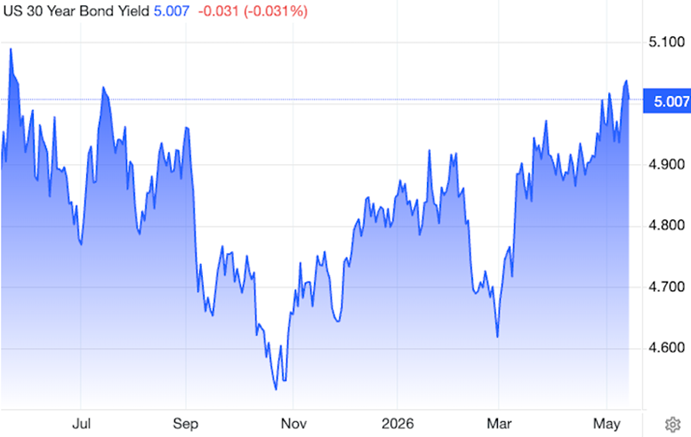
Yields are climbing sharply as geopolitical tensions, a $1.9 trillion deficit, and waning foreign demand undermine their safe-haven status. China is selling Treasuries at rates unseen since 2008.
The resulting pressure threatens the dollar’s purchasing power, fuels inflation risks, and may force the Federal Reserve into controversial debt monetization (i.e. quantitative easing, where the Fed buys Treasuries by printing money, at the risk of massive inflation).
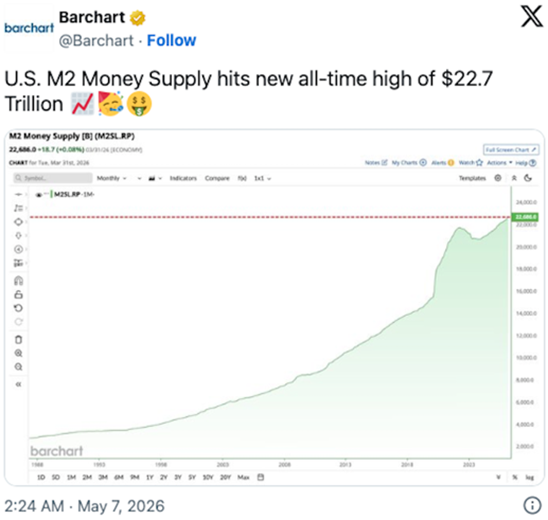
As the chart below shows, US M2 money supply just hit a new all-time high of $22.7 trillion.
When the money supply increases faster than economic growth, it dilutes the value of existing currency, historically causing precious metal prices to rise as a tangible store of value. (Medium)
The US dollar is climbing this week as inflation fears push bond yields higher. Yesterday the US dollar index DXY hit a 1.5-week high on a stronger-than-expected Producer Price Inflation (PPI) report, which jumped 1.4%, the largest gain since March 2022. According to Barchart, the buck also saw safe-haven support on concerns that the US-Iran ceasefire may break down after President Trump said the current ceasefire was on “life support.”
Earlier this month, optimism over a possible end to the war pushed the dollar back to pre-conflict lows. Reuters said “Whether a trapdoor now opens beneath the dollar if the war ends and the Strait of Hormuz reopens is now a central question for global markets.”
The May 7 article identified three main issues:
- The first is how quickly an oil-price normalization would revive Federal Reserve easing speculation.
- The second issue is the planned Beijing summit between Trump and China’s President Xi Jinping and whether it revives pressure for further yuan strength to ease one more friction point on an already fraught list of trade feuds.
- The third factor, and the one dollar bears tend to underestimate, is the elephant in the room: the eye-popping Wall Street rebound, driven by sharply upgraded US profit forecasts and blistering AI investment spending.
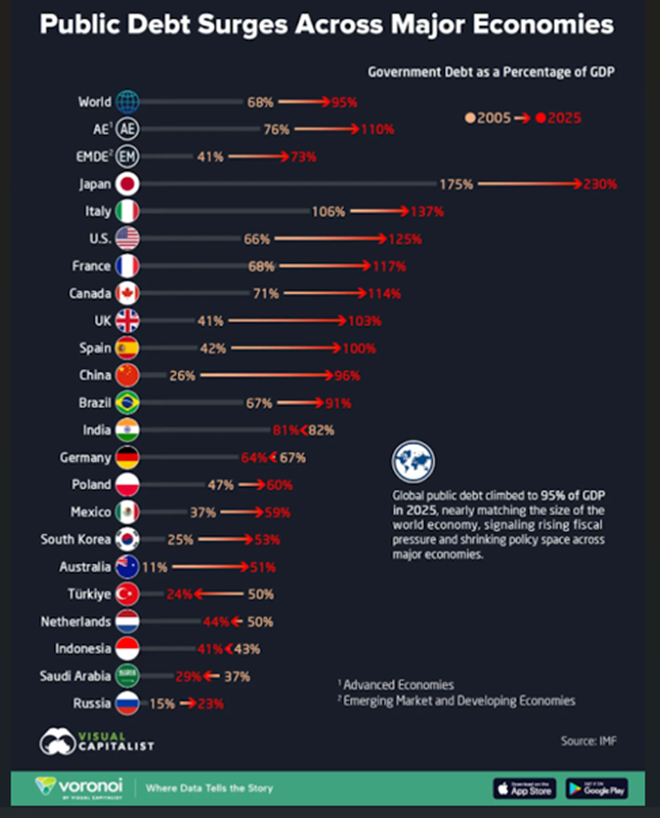
Record global government debt—with US federal debt alone approaching $40 trillion — drives a structural bull market in precious metals. As unsustainable debt loads and persistent fiscal deficits threaten fiat currency purchasing power, investors increasingly utilize gold and silver as critical hedges against inflation and the devaluation of paper assets. (RBC Global Asset Management)
The infographic below shows how government debt has diverged across major economies.
The United States (125%), France (117%), and the United Kingdom (103%) have all crossed the 100% threshold. Japan remains an outlier, with debt reaching 230% of GDP, the highest among major economies. These elevated levels reflect aging populations, persistent deficits, and large-scale stimulus efforts.
Emerging markets and developing economies saw debt rise from 41% to 73% of GDP. China’s debt jumped sharply from 26% to 96%, while Brazil and South Africa also saw notable increases.
Industrial demand
The amount of silver used by industry is climbing sharply.
According to GR Reserve, “Industrial applications consumed 680 million ounces of silver in 2024, representing 59% of total global demand. This marks a dramatic shift from just a decade ago when industrial uses accounted for roughly half that share.
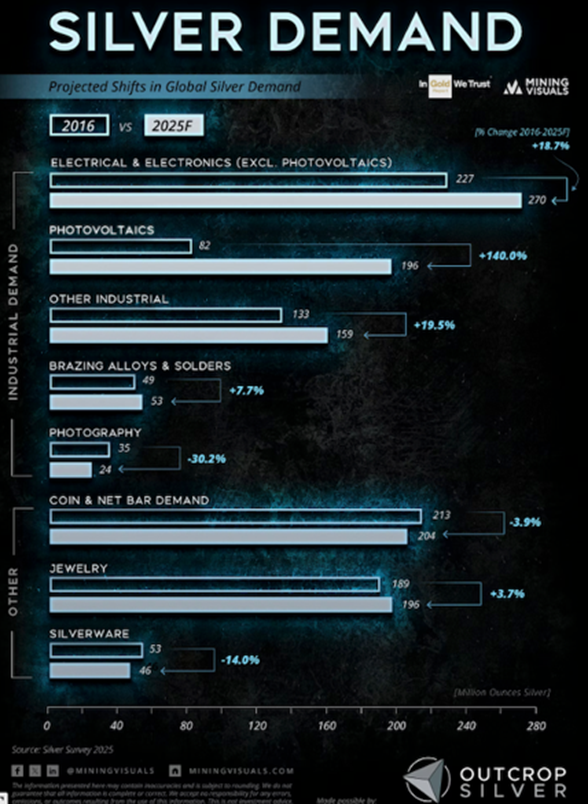
Silver’s unique properties make it irreplaceable across critical industries. The metal conducts electricity and heat better than any other element while offering natural antimicrobial characteristics and exceptional reflectivity. These qualities create persistent demand regardless of economic cycles.
The amount of silver used by industry is climbing sharply
Electronics, solar energy, electric vehicles, and medical devices now depend on silver for core functionality.”
Conclusion
The Iran war has caused massive energy inflation in the form of skyrocketing oil and natural gas prices (except in the Permian region of the US where there is a glut and natgas prices are negative).
With petroleum such a crucial feedstock in so many products — everything from gasoline and jet fuel to plastics and textiles — inflation is ripping through the world economy and, in my opinion, it’s not going to stop anytime soon. Even if the war ends tomorrow, the backlog of oil & gas shipments in the Persian Gulf and resulting supply chain disruptions will take months to resolve.
Following missile strikes on Qatar’s Ras Laffan Industrial City, repairing the damaged liquefied natural gas (LNG) facilities is expected to take up to five years. (Anadolu Ajansi)
US producer prices rose far more expected in April, increasing 1.4% from the previous month and 6% on an annual basis. That’s huge, and imo, those price increases will surely be passed through to consumers.
Stripping out food and energy, core producer prices “rose 5.2% year over year, hotter than estimates of 4.3% and the previous month’s 4% revised gain.”
The Consumer Price Index (CPI) was 3.8% higher than a year ago, the largest annual increase in three years.
“Energy prices rose 3.8% from the previous month after March showed a 10.9% monthly jump. The overall energy index was 17.9% higher than a year ago, while the index for gasoline rose 28.4%,” said Yahoo Finance.
Precious metals, particularly gold, serve as historical hedges against inflation and currency devaluation because they are tangible, globally recognized assets with a limited supply. When the purchasing power of fiat currency drops, investors often shift their capital to physical metals to preserve wealth. (Atkinsons’s Bullion & Coins)
Along with rising inflation, monetary demand for silver is buttressed by weakening demand for the US dollar, evidenced by high US Treasury yields and the mostly emerging-market de-dollarization trend; and the global debt crisis that is weighing heavily on fiat currencies.
Silver differs from gold in that it has a plethora of industrial applications that can shore up demand regardless of monetary policy or global events. Along with the traditional uses of silver, in electronics (including AI and 5G), solar, automotive, medical, water treatment, chemical catalysts, brazing and soldering, and silver bearings, there are several new, exciting applications on the horizon. These include electromagnetic shielding; 3D printing; photographic and imaging; antimicrobial textiles; silver nanoparticles used in touchscreens, smartphones and OLED displays; in the production of hydrogen fuel cells, in vanadium oxide batteries, and perhaps most importantly, in solid state batteries.
These new batteries contain roughly 750 grams of silver per vehicle in a mid-size EV with a 75 kWh pack, compared to between 25 and 50 grams of silver in current liquid lithium-ion EVs.
Solid-state architecture at Samsung SDI’s silver intensity would represent a 15x to 30x increase per vehicle in silver content.
Silver supply isn’t keeping up with demand. Which is why silver is entering its sixth consecutive year of deficits in 2026.
Metals Focus forecasts a 46.3-million-ounce deficit this year.
Record demand from industrial sectors, particularly solar panels, electronics and electric vehicles, is outpacing flat mine supply.
The ongoing structural supply deficit makes the metal vulnerable to future squeezes. China slapping export restrictions on silver after the US declared it a critical mineral will only exacerbate market tightness.
Meanwhile, China’s silver imports hit an all-time high in March, fueled by demand from retail investors and the solar industry.
Technical analysis shows silver prices are poised for another rip. The historical chart shows a cup and handle breakout pattern. “The longer the base the higher in space.”
Some analysts see resistance at $90, Sprott Money says it’s $95. Silver could even retest silver’s record-high, end-of-January $120, with Sprott Money reasoning that May will be the eighth consecutive month of $50+ silver prices.
The last two times silver approached $50, in 1980 and 2011, it hit then-record highs.
Remember, silver typically lags gold during the initial phase of a precious metals bull market but eventually accelerates to post larger percentage gains.
We saw this last year, with silver outperforming gold by 135% to 64%. In 2020, the year of the pandemic, silver’s ~48% gain was nearly double gold’s 25% increase.
Richard (Rick) Mills
aheadoftheherd.com

Legal Notice / Disclaimer
Ahead of the Herd newsletter, aheadoftheherd.com, hereafter known as AOTH.Please read the entire Disclaimer carefully before you use this website or read the newsletter. If you do not agree to all the AOTH/Richard Mills Disclaimer, do not access/read this website/newsletter/article, or any of its pages. By reading/using this AOTH/Richard Mills website/newsletter/article, and whether you actually read this Disclaimer, you are deemed to have accepted it.