 RSS Subscribe
Gini Coefficient the current U.S. wealth gap – AOTH

U.S. income and wealth concentration has systematically eclipsed previous historic peaks, easily pacing past the structural divides that triggered Europe’s “Spring of the Nations” revolutions in 1848.
The modern American economy exhibits a level of extreme concentration that fundamentally outpaces the eras famously defined by class Stratification.
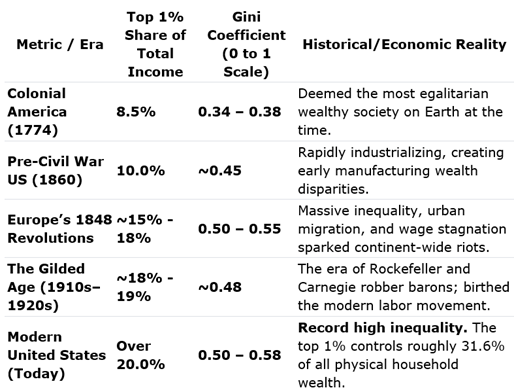
While Joe and Suzy Sixpack are cushioned from literal mid-19th-century famine due to modern social safety nets, the underlying structural math presents a familiar instability:
In 1848, inequality was driven by physical factories and land ownership. Today, inequality is turbo-charged by corporate equity, automation, and asset inflation. Because the top 10% of households control over two-thirds of all U.S. wealth (mostly held in stocks), market surges aggressively widen the gap while everyday real wages stall.
From 1945 to 1970, high union density and progressive tax structures meant economic growth was equally distributed. That model has completely inverted; since the late 1970s, the income of the top 0.01% has grown at multiple times the rate of the bottom 20%.
In modern terms, the divide shows up via skill premiums and tech centralization. High-earning corporate tiers consume luxury items and properties, driving up housing benchmarks and inflation, while the bottom rungs are forced to borrow at 22%+ APR just to clear basic cost-of-living hurdles.
While the popular narrative points to inequality, economic data shows that the Arab Spring in 2011 was actually triggered by stagnant mobility and an unprecedented global food price shock, rather than raw income gaps alone. Ironically, official pre-revolution data showed that countries like Egypt and Tunisia had relatively moderate or low income inequality compared to international standards.
However, since those uprisings, the economic reality across both the Middle East and the United States has deteriorated significantly.
Gini Coefficient
On paper, the baseline measure of income inequality—the Gini Coefficient (where 0 means perfect equality and 100 means one person holds everything)—shows that the current U.S. wealth gap is fundamentally wider than the official gaps in the Middle East when the revolutions broke out.
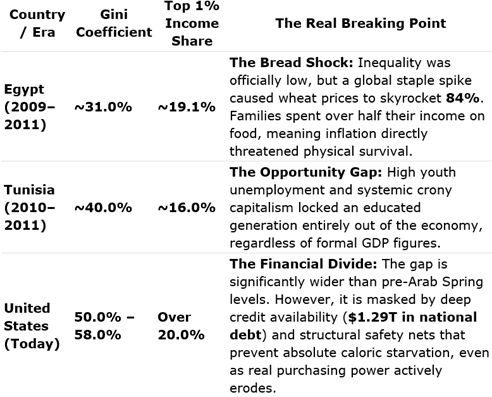
Since 2011, economic inequality has globalized and deepened along two major axes.
Post-2011 data compiled by the World Inequality Lab revealed that tracking methods had vastly understated true Middle Eastern wealth. Today, the top 10% of earners in the Middle East capture a staggering 56% to 64% of total national income. Political instability following the Arab Spring caused local economic growth to plummet from 5% down to 2%, leaving the working class with high inflation and fewer options while billionaire wealth in the region surged.
In 2011, the U.S. was still recovering from the Great Recession, and the Occupy Wall Street movement protested a top 1% that took home roughly 18% of the income wealth. Today, that share has climbed past 20%.
Because modern wealth generation is tied tightly to the stock market, real estate assets, and corporate equity rather than wage-labor, the gap inflates automatically every time the markets rally. This creates the modern paradox: top-line corporate metrics and stock indices are hitting record highs, while Joe and Suzy Sixpack are experiencing a compressed 3.8% savings rate and multi-decade highs in credit card APR.
Modern U.S. food and housing metrics do not indicate a risk of immediate calorie-driven social breakdown, but they have officially matched or broken historical multi-decade stress peaks. The modern breaking point is not absolute starvation, but a structural “affordability hangover” that leaves millions of households without any discretionary income after paying for the bare necessities.
While the historical 1848 or 2011 Arab Spring breaking points were triggered by food costs suddenly consuming 40% to 50% of household budgets, the modern American stressor is a “double whammy” where hyper-sticky shelter inflation aggregates with a 30% post-pandemic baseline reset for groceries.
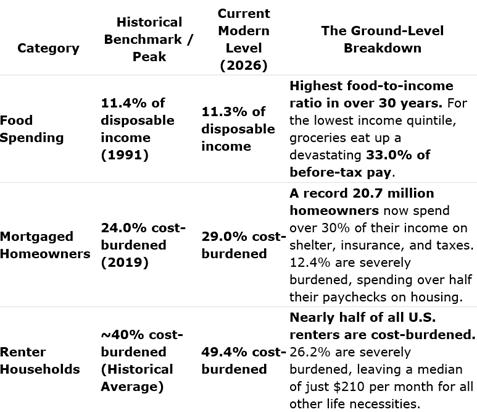
Historically, societies collapse when the price of bread spikes past a family’s physical ability to purchase calorie survival. The modern U.S. framework absorbs this stress through different, non-violent pathways.
As established, families are absorbing the 25.1% grocery hike and 33.9% shelter hike by leaning on a record-high $1.29 trillion in credit card debt. Credit availability delays political or social boiling points, masking a severe structural decay under the guise of steady top-line consumer spending.
Rather than rioting, young adults are adjusting via delayed independence. The homeownership rate for households under 35 has dropped to 34.5%, while 33.6% of adults aged 18 to 34 live with their parents. Social unrest is replaced by structural stagnation.
In 2019, low-income households had a modest inflation-adjusted cushion of $410 left over each month after paying rent. Today, that residual income has been cut in half to $210, while non-housing costs like car insurance have surged up to 50%. The result is a quiet, systemic wealth extraction rather than a sudden explosion
Conclusion
When families completely max out their credit limits, they hit a hard wall where the credit safety valve stops functioning, causing severe microeconomic distress to ripple through the household.
However, the reason the broader U.S. economy hasn’t experienced a total macro-level collapse yet comes down to how banks manage credit limits and how the financial system absorbs the fallout.
If credit lines were fixed, millions of families would have hit the wall already. Instead, the Federal Reserve Bank of New York’s latest Q3 data reveals that financial institutions extended aggregate credit card limits by $115 billion in just three months.
Banks are shifting lending standards to keep the engine moving. If Joe and Suzy Sixpack manage to keep making their minimum payments, banks often proactively raise their limits to capture more of that 22.36% compounding interest. The wall is actively being pushed back by lenders eager to profit off the cash-flow gap.
When an individual family does exhaust their credit limit and can no longer make minimum payments, the sequence of events is a quiet, painful squeeze rather than a sudden explosion.
The card is immediately blocked, cutting off the family’s ability to use plastic for daily groceries or utilities.
After 60 days of missed payments, issuers apply a “default APR” (often spiking the interest rate past 30%), causing the balance to balloon aggressively.
If the debt remains unpaid after 180 days, it is sold to third-party collectors. This frequently leads to lawsuits, legal property liens, and court-ordered wage garnishments. The system legally extracts money directly from the worker’s paycheck before they even see it to settle the debt.
If millions of households are experiencing this credit trap, why doesn’t the entire macro economy default?
As established, the top 40% of high earners account for over 60% of all consumer spending. Even if the bottom 20% completely defaults and enters delinquency collections, the top-tier demand for travel, tech, and services keeps luxury retail and overall GDP numbers looking healthy.
The New York Fed’s tracking shows that serious credit card delinquencies (90+ days late) actually stabilized slightly at 6.87%. While this means a significant number of families are under severe stress, it indicates that the vast majority are still managing to barely clear the minimum payment hurdle to protect their credit scores, preventing a cascading wave of bank defaults.
Because unemployment remains low at around 4.4%, workers still have a steady stream of wage income. They are using 100% of their fluid cash to service their debt and buy basic necessities, keeping the broader financial machine lubricated even as household savings are wiped out.
In short, the poop is hitting the fan—but it’s happening sequentially, household by household, in the form of collections, ruined credit, and legal stress, rather than all at once in a singular macroeconomic event.

Legal Notice / Disclaimer
Ahead of the Herd newsletter, aheadoftheherd.com, hereafter known as AOTH.Please read the entire Disclaimer carefully before you use this website or read the newsletter. If you do not agree to all the AOTH/Richard Mills Disclaimer, do not access/read this website/newsletter/article, or any of its pages. By reading/using this AOTH/Richard Mills website/newsletter/article, and whether you actually read this Disclaimer, you are deemed to have accepted it.