 RSS Subscribe
Consumers gaslit by inflation gauges that always alter reality to favor the issuer – Richard Mills

“Milton Friedman famously said: “Inflation is always and everywhere a monetary phenomenon, in the sense that it is and can be produced only by a more rapid increase in the quantity of money than in output.
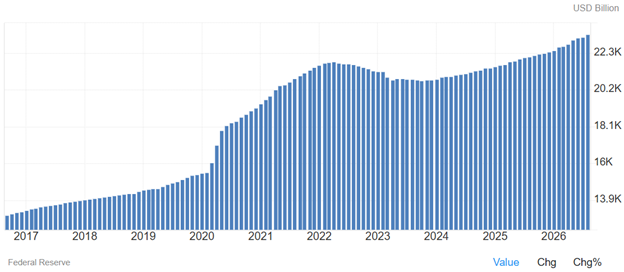
Of course, we all know the driver of the quantity of money is government spending priorities, and recently the government has been spending a lot.
Milton Friedman: It is always and everywhere, a monetary phenomenon. It’s always and everywhere, a result of too much money, of a more rapid increase in the quantity of money than an output. Moreover, in the modern era, the important next step is to recognize that today, governments control the quantity of money. So that as a result, inflation in the United States is made in Washington and nowhere else.
Friedman: If you listen to people in Washington and talk, they will tell you that inflation is produced by greedy businessmen or it’s produced by grasping unions or it’s produced by spendthrift consumers, or maybe, it’s those terrible Arab Sheikhs who are producing it. Now, of course, businessmen are greedy. Who of us isn’t? Trade unions are grasping. Who of us isn’t? And there’s no doubt that the consumer is a spendthrift. At least every man knows that about his wife.
Friedman: But none of them produce inflation for the very simple reason that neither the businessman, nor the trade union, nor the housewife has a printing press in their basement on which they can turn out those green pieces of paper we call money.” Heritage Foundation
Spending
In fiscal year 2025, the U.S. government spent a total of $7.01 trillion. For the current fiscal year (FY 2026), the government has spent $6.81 trillion so far (as of August monthly data updates), and the total amount is officially projected to increase sharply over the coming decade. Federal spending is outpacing previous years due to rising mandatory obligations and interest on the national debt.
Key Drivers Behind the Spending Growth
The projected increase in government spending to $11.4 trillion by 2036 is driven by three main factors:
- The U.S. currently spends over $2.8 billion every day just on net interest payments. The Peterson Foundation notes that net interest is slated to escalate from 14% of the entire federal budget in 2025 to 25% by 2056.
- Aging demographics mean structural spending on Social Security and Medicare continues to rise steadily. Mandatory outlays already constitute about 59% of all federal spending.
- Because government spending continuously outpaces federal revenues ($5.23 trillion in 2025), public debt is forecasted by the CBO to rise from 101% of GDP in 2026 to 120%ofGDP by 2036
According to data from the Congressional Budget Office (CBO) and the Peterson Foundation, national defense is a massive dollar amount—estimated at $898 billion to over $1 trillion for FY 2026.
Defense is categorized as discretionary spending, meaning Congress must manually debate and approve its budget every year. In contrast, mandatory spending (Social Security and Medicare) is legally on autopilot and grows automatically as more Americans qualify.
In a major fiscal milestone, the U.S. government now spends more on net interest payments to service its national debt than it spends on the entire domestic military budget.
While policy shifts or geopolitical conflicts can cause abrupt spikes in military funding—such as proposals to push defense budgets toward $1.5 trillion—the structural, compounding baseline growth of the U.S. deficit is systematically dictated by healthcare, retirement, and interest costs.
CPI
Inflation’s impact on purchasing power over time is a well-documented economic reality, and changes to how it is measured have long been a subject of intense debate among economists, policymakers, and investors.
When discussing how inflation calculations change—specifically regarding the Consumer Price Index (CPI)—there are two main schools of thought.
Critics argue that methodological updates over the last few decades (such as those introduced in the US during the 1980s and 1990s) were designed to intentionally understate the true cost of living.
The primary beneficiary of a lower official inflation rate is often cited as the government, due to several key factors:
- Programs like Social Security adjust their benefits annually based on Cost-of-Living Adjustments (COLA). A lower calculated inflation rate means the government pays out less in benefits over time.
- Income tax brackets are adjusted for inflation. If the official inflation rate is kept lower, taxpayers move into higher tax brackets faster as their nominal wages rise, increasing government tax revenue.
- A lower reported inflation rate helps keep interest rates lower, which reduces the borrowing costs for government debt.
The government agencies that calculate inflation (such as the Bureau of Labor Statistics in the US) modify their formulas to better reflect changing consumer behavior.
Historically, the CPI measured a fixed basket of goods to track how much more it cost over time to maintain an identical lifestyle. However, following the Boskin Commission in 1996, the Bureau of Labor Statistics (BLS) shifted toward a Cost-of-Living Index (COLI) framework and over the years have introduced several controversial adjustments.
- Substitution Bias Adjustments: The logic is that if beef becomes too expensive, consumers buy chicken instead. Critics argue this changes the metric from measuring the cost of maintaining a constant standard of living to measuring the cost of survival.
The modern CPI model accounts for this by shifting item weights. Critics contend that while this reflects how people adapt to inflation, substituting down to lower-quality items represents a decline in standard of living, which the index masks. - Hedonic Adjustments: This accounts for quality improvements in goods. For example, if a new smartphone costs the same as last year’s model but has a faster processor, the BLS may treat this as a price decrease because you are getting more value per dollar. Critics point out that you still cannot buy the older, cheaper phone, so your actual out-of-pocket cost didn’t go down.
Introduced to automatically dampen the statistical impact of goods experiencing sharp price increases. Critics view it as a mathematical trick to understate inflation. - Geometric Weighting: Instead of just tracking straight price increases, the formula was updated to give less weight to items that are rapidly rising in price, under the assumption that consumers will buy less of them.
Critics often point to these methodologies as ways the current inflation gauge alters reality to always favor the issuer. The reported figures, from the current gov’t admin, are artificially suppressed to financially benefit the government, who is THE issuer.
The primary source of skepticism stems from the financial incentives of governments and central banks to keep official inflation numbers low
| Mechanism | Impact of Lower Reported Inflation |
| Entitlement Payouts | Reduces mandated annual cost-of-living adjustments (COLAs) for programs like Social Security. |
| National Debt | Lowers the interest obligations the government owes on inflation-indexed government bonds (like TIPS). |
| Tax Revenues | Slows the adjustment of tax brackets, pushing citizens into higher tax categories via “bracket creep” even if their real purchasing power hasn’t increased. |
| Economic Growth Perception | Real Gross Domestic Product (GDP) is calculated by stripping out inflation. Lower reported inflation artificially inflates reported real GDP growth. |
Of course, mainstream economists and organizations like the U.S. Bureau of Labor Statistics strongly reject the idea of intentional manipulation.
They assert that historical methodologies actually overstated the true rise in the cost of living by ignoring consumer choice and technological advancements. Mainstream consensus argues that the changes simply made the calculations more rigorous and mathematically precise.
Impact on Reported Real GDP Growth
Changes to inflation measurement directly paint a more optimistic picture of long-term economic health by mathematically boosting reported real GDP growth and preventing real wages from appearing to decline. Because “real” metrics are calculated by subtracting inflation from raw, nominal dollar figures, any methodology that lowers the reported inflation rate automatically inflates the resulting “real” growth rates.
Gross Domestic Product is initially measured in current dollars (Nominal GDP). To find Real GDP—the actual physical output of an economy—economists deflate Nominal GDP using an inflation index called the GDP Price Deflator (which relies heavily on consumer price data).
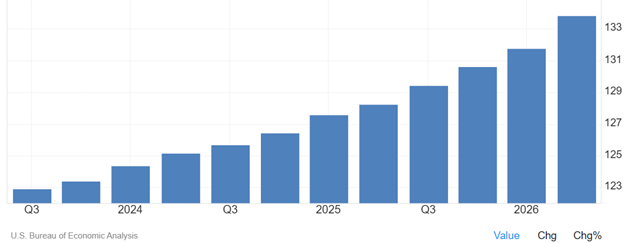
If Nominal GDP grows by 5% and the old inflation formula calculates inflation at 4%, reported Real GDP growth is 1%. If updated methodologies (like hedonic quality modeling) calculate that same inflation period at just 2%, reported Real GDP growth instantly jumps to 3%. The economy appears three times stronger on paper, even though the raw transaction dollars remained identical.
Because technological improvements are counted as “price drops” under hedonic adjustments, the tech sector’s contribution to Real GDP is significantly amplified. Statisticians are effectively reporting that the economy produced “more volume” or “higher capacity,” masking the reality if actual factory output or consumer unit purchases stagnated.
U.S. manufacturing production fell 0.3% in August 2026, breaking seven straight months of modest growth. The broader sector is stalling under the weight of elevated energy costs, high interest rates, and tariff-related supply difficulties. Real output growth for the year is projected at a sluggish 1% to 1.5%, as gains in defense and AI data center equipment are offset by declines in consumer durables like cars and home electronics.
In contrast, consumer spending is pacing strong. While a sharp monthly contraction occurred in July, retail sales roared back with a 1.2% surge in August 2026—beating consensus expectations. Adjusted for inflation, August real spending grew by a solid 0.8%, driven by a bounce-back in automotive purchases and e-commerce. Overall retail sales for the year are trending to close out up roughly 4.4% to 5.5%, proving that consumer unit volume demand is not stagnating.
The Impact on Reported Real Wage Growth
Real wages represent the true purchasing power of a worker’s take-home pay. They are calculated by adjusting nominal wages against the Consumer Price Index (CPI).
If your boss gives you a 3% raise, but your physical cost of rent, food, and energy rose by 5%, your real standard of living has fallen by 2%. However, if the official CPI framework uses substitution formulas to calculate inflation at only 2%, your official data record will show +1% real wage growth. Critics argue this mathematical discrepancy creates a psychological disconnect where official data insists workers are getting wealthier, while households feel increasingly squeezed.
When researchers look at multi-decade wage stagnation, the choice of inflation index entirely dictates the conclusion. Using the modern adjusted CPI, real wages have generally trended slightly upward or remained flat over the last few decades. If researchers swap out the modern index for older, fixed-basket methodologies, real median wages for many demographics appear to have steadily declined since the 1970s.
Transfer of wealth
The compounding effect of these statistical adjustments over three decades has created a profound divergence between official economic data and household financial reality.
While mainstream economists argue these changes simply modernize the data, critics and financial analysts contend that the end result for consumers is a massive, quiet transfer of wealth. Consumers have lost purchasing power, safety nets, and institutional trust.
Because these adjustments structurally lower the reported inflation rate, any financial contract or government program tied to the CPI pays out less over time.
Cost-of-Living Adjustments (COLAs) for seniors and disabled citizens are calculated directly using the CPI. By lowering the reported inflation rate by even 1% to 2% per year, the compounding effect over a 20-year retirement results in thousands of dollars in lost purchasing power. Recipients receive smaller checks than they would have under original, fixed-basket calculations.
The IRS adjusts federal income tax brackets annually for inflation so workers aren’t pushed into higher tax brackets just because of inflation raises. Because modern CPI understates inflation, tax brackets do not widen fast enough. Over decades, this “bracket creep” has quietly pushed middle-class workers into higher tax percentages, costing households billions in aggregate wealth.
The integration of “Substitution Bias” into the CPI fundamentally changed the metric from measuring the cost of maintaining a specific lifestyle to measuring the cost of survival.
Under the old system, if steak became too expensive, the index recorded a high inflation rate, signalling that consumers were being priced out of their lifestyle. Under the modern system, when consumers switch from steak to hamburger, or from fresh vegetables to frozen, the system adjusts its weightings.
The end result is that the system treats a forced reduction in your standard of living as a rational consumer choice. It mathematically erases the loss of quality of life, telling the consumer they are doing fine, while their actual daily experience feels like a regression.
Hedonic adjustments mean that if a product improves technologically, it is counted as a price drop, even if the cash required to buy it stays the same or goes up.
A consumer cannot pay rent or buy groceries with the “intellectual value” of a microchip. If a smartphone or a car costs $1,000, the consumer must hand over $1,000 of cash. If statisticians declare that it was “effectively” only a $500 purchase because the device is twice as fast as last year’s model, it creates an illusion of wealth. The consumer’s bank account is depleted by the full amount, but the official data records a deflationary victory.
Conclusion
Perhaps the most damaging end result is the complete erosion of public trust in institutional economic data.
When the government announces inflation is down to 2.5%, but a consumer’s home insurance has doubled, their utility bills are up 40%, and groceries cost 30% more than a few years prior, it creates acute cognitive dissonance.
Consumers feel gaslit by the data. This disconnect drives people toward alternative financial assets, deepens populist political divides, and leaves the average citizen feeling deeply cynical about official economic reporting.
Richard (Rick) Mills
aheadoftheherd.com

Legal Notice / Disclaimer
Ahead of the Herd newsletter, aheadoftheherd.com, hereafter known as AOTH.Please read the entire Disclaimer carefully before you use this website or read the newsletter. If you do not agree to all the AOTH/Richard Mills Disclaimer, do not access/read this website/newsletter/article, or any of its pages. By reading/using this AOTH/Richard Mills website/newsletter/article, and whether you actually read this Disclaimer, you are deemed to have accepted it.