 RSS Subscribe
Flattening of the curve predicts economic downturn in mid ‘27 – Richard Mills

“The bond market is on the brink of signaling that a series of Federal Reserve interest-rate hikes will start shifting the narrative toward the risk that the US economy stalls out.
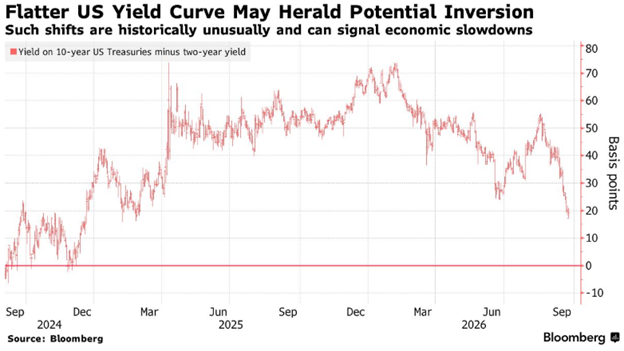
The extra yield investors demand to hold 10-year Treasuries over two-year notes shrank to as little as 17 basis points last week, the slimmest gap since early 2025. This so-called flattening of the curve increases the possibility that the 10-year will soon yield less than shorter maturities, a closely watched phenomenon known as a curve inversion.
An inverted curve historically has offered a powerful signal: It has preceded each of the last eight recessions going back to the 1960s, although its predictive power proved faulty earlier this decade. It’s essentially bond investors’ way of showing they see the Fed pushing rates high enough to stymie the economy as it seeks to tame inflation.” Bloomberg
“Bond yields steadied somewhat on Friday but remained at historic levels. The 10-year Treasury yield, which climbed to its highest point since 2007 on Thursday, was last trading at around 5.183%. The 30-year yield, which reached its highest level since 2004 on Thursday, stood at around 5.478%. The 10-year yield has risen 16 basis points just this week.
Several forces pushed yields higher this week: Federal Reserve Governor Michael Barr struck a hawkish tone, energy prices stayed elevated amid the Iran conflict, and a robust purchasing managers’ report added to the pressure. According to the CME $CME -1.65% FedWatch tool, fed funds futures now price in about a 66% chance of a rate hike at the October meeting.
The 30-year fixed mortgage rate has climbed to 7.45%, a level not seen since 2024, as rising Treasury yields lift consumer borrowing costs. In a note to clients, Morgan Stanley $MS -0.01%’s Heather Berger said higher borrowing costs are set to squeeze household outlays, with the drag concentrated in goods purchases, and that the bank is forecasting real consumption growth to slow by 40 basis points next year as a result.” Quartz
“The US, France and Canada have increased their debt-to-GDP ratios by 20%+ over the last decade. China’s rise was simply the largest debt binge in recent history. The 65% increase is much higher if local-government debt increases are included. The recent spike in bond yields signals what markets think of such reckless government spending. Greece and Portugal went through painful austerity and reduced their debt burdens. The longer others wait and pretend everything is fine, the deeper and more painful the unavoidable adjustments will be. One way or another it won’t be pretty. Buckle up.” Michael A. Arouet
A growing wall of US corporate debt is set to mature from 2027, putting pressure on companies to refinance borrowings raised at ultra-low interest rates during the pandemic.
About $4.3 trillion of non-financial corporate bonds issued in US markets will mature between 2027 and 2031, a Reuters analysis of LSEG data showed. Annual maturities rise from about $572 billion in 2027 to roughly $1.03 trillion in 2030, after many companies pushed debt into later years through refinancing.
The challenge comes as global debt has climbed above a record $365 trillion, according to the Institute of International Finance, while higher Treasury yields have lifted refinancing costs across markets. The benchmark 10-year US Treasury yield is above 5%, around its highest level since 2007.
As the debt comes due, companies that locked in cheap fixed-rate funding earlier in the decade will increasingly have to refinance at higher costs, pressuring earnings and cash flow. Reuters
Yield curve
The flattening of the U.S. Treasury yield curve—specifically the narrowing of the spread between 2-year and 10-year yields to just 17 basis points—signals that bond investors are braced for a significant economic slowdown or policy error. When short-term yields surge closer to long-term yields, it typically reflects a market anticipating that aggressive central bank interest rate hikes designed to curb inflation will restrict economic growth over the long haul.
As of late September 2026, the yields sit at multi-year highs, with the 2-year note near 4.91% and the 10-year note at 5.22%.
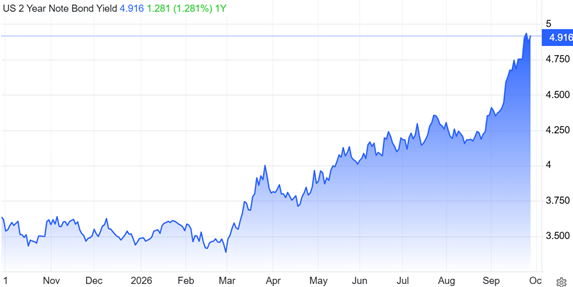
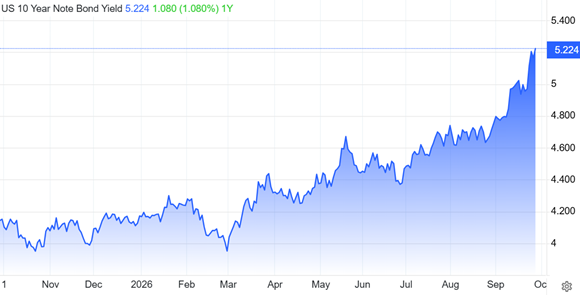
A normal yield curve slopes upward because investors require a higher premium to lock up capital for a decade compared to just two years. When the curve flattens rapidly toward zero (and potentially goes negative), it reveals a stark divergence in market beliefs:
- Driven primarily by immediate expectations of Federal Reserve monetary policy – A recent wave of hawkish Fed actions and geopolitical-driven inflation pressures (such as surging oil prices from Middle East conflicts) are keeping short-end yields heavily elevated.
- Dictated by long-term growth potentials and structural economic health – While heavy government debt issuance and infrastructure needs have pushed the 10-year yield past 5.2%, its inability to maintain a healthy premium over shorter debt proves the market lacks confidence in robust future expansion.
If this final 17 basis point gap closes and the 10-year yield drops below the 2-year yield, a formal yield curve inversion occurs. Historically, a sustained 2s10s inversion is one of the most reliable recession indicators in finance.
An inversion implies that investors expect the Fed will tighten policy so sharply that it will eventually be forced to aggressively cut interest rates in the future to repair a stalled economy.
Traditional banking centers on a “borrow short, lend long” model. When short-term funding costs rise faster than long-term loan yields, banks see profit margins evaporate. This dynamic has already triggered corrections in major financial indexes like the KBW Bank Index.
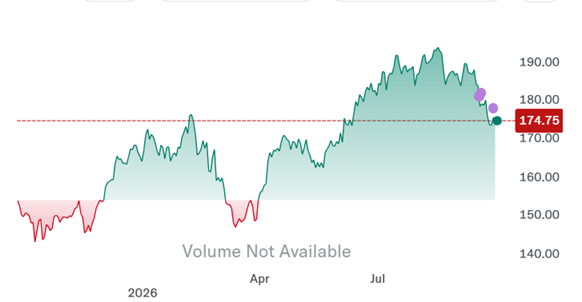
As profitability shrinks, commercial lenders tighten loan criteria for small businesses and consumers. This directly cools capital expenditure, lowers market liquidity, and heightens consumer delinquency risks.
Dot plot
The primary catalyst lifting short-dated bonds (like the 2-year note) is the stark upward revision in the Fed’s quarterly Summary of Economic Projections (SEP) and its infamous “dot plot.”
The updated projections caught the bond market off guard by mapping out a strict “higher-for-longer” monetary policy path to fight inflation, which is structurally pressured by a prolonged Middle East energy shock and intensive AI infrastructure spending.
Projections:
- One additional rate hike is heavily projected by 16 out of 18 officials before December.
- Lower Trajectory Rates will remain entirely flat at their restrictive peak.
- Zero rate cuts expected in 2027.
- The neutral rate has structurally drifted higher, implying permanently higher borrowing costs.
The Fed’s updated models reveal that core PCE inflation is tracking at 3.4% for 2026, and officials openly admit they do not anticipate reaching their 2% target until 2028. This 5-year inflation overshoot strips away the Fed’s ability to cut rates to alleviate short-term economic pain.
Despite higher rates, the Fed revised its 2026 U.S. GDP growth forecast upward to 2.3% while tracking steady unemployment at 4.1%. Because the real economy is not showing immediate signs of breaking, the bond market is forced to accept that the Fed has an open runway to leave rates elevated.
This aggressive short-term rate floor, colliding with a 10-year yield that is capped by long-term growth limitations, is the exact mechanics squeezing the yield spread down to its razor-thin 17-basis-point margin.
Conclusion
An inverted yield curve is arguably the most accurate crystal ball in macroeconomics. Since 1955, every single U.S. recession has been preceded by an inversion of the 2-year and 10-year Treasury spread.
However, the bond market operates on a lag. An inversion does not mean the economy crashes tomorrow; it means a clock has started ticking.
Historically, the average time between the moment the 2-year yield crosses above the 10-year yield and the official onset of a recession (as defined by the National Bureau of Economic Research) is 12 to 15 months.
To understand what will happen here, we must look at the unprecedented backdrop of the last few years. The bond market actually sustained a record-breaking 784-day inversion from July 2022 to August 2024, but a recession never materialized. The economy defied the curve due to massive pandemic-era savings, a structural labor shortage, and aggressive fiscal spending.
When the curve briefly un-inverted in late 2024 / 2025, many declared that the yield curve was “broken” or a “false positive”. But history notes that the true danger zone isn’t the initial inversion—it is the re-flattening and rapid exit from it.
Now, in September 2026, the curve has aggressively compressed back down to 17 basis points because the Fed resumed rate hikes to choke out lingering structural inflation.
Because this is a “double-dip” flattening after an extended period of heavy monetary tightening, the macroeconomic playbook points to a few distinct sequencing steps over the next 12 to 18 months:
- The 17-basis-point gap tells us that banks are actively entering a severe credit squeeze. Over the next two quarters, expect commercial bank lending to dry up drastically. Small businesses will struggle to roll over short-term debt, and corporate defaults will edge higher.
- Currently, employment remains resilient at 4.1%. However, unemployment is a lagging indicator. As corporate profit margins compress under the weight of a 4%–4.125% Fed funds rate, hiring freezes will transform into broad-based layoffs by early to mid-2027.
- Right before the recession physically hits, the yield curve will violently un-invert, shifting from flat to steep. This happens when the Fed realizes it has overtightened, panic-cuts short-term rates, and short yields plummet faster than long yields.
When the curve steepens sharply out of an inversion or near-inversion, the recession is typically weeks or months away.
The bond market is telling you that a “soft landing” is mathematically improbable. The Fed’s latest rate hikes are successfully breaking aggregate demand to kill inflation, and an economic downturn remains the highly likely structural resolution by mid-2027.
Richard (Rick) Mills
aheadoftheherd.com

Legal Notice / Disclaimer
Ahead of the Herd newsletter, aheadoftheherd.com, hereafter known as AOTH.Please read the entire Disclaimer carefully before you use this website or read the newsletter. If you do not agree to all the AOTH/Richard Mills Disclaimer, do not access/read this website/newsletter/article, or any of its pages. By reading/using this AOTH/Richard Mills website/newsletter/article, and whether you actually read this Disclaimer, you are deemed to have accepted it.