 RSS Subscribe
Monetary inflation vs ‘economic shock’ price rises – Richard Mills

2026.07.16
As the economist Milton Friedman famously summarized, “Inflation is always and everywhere a monetary phenomenon.” It is an artificial expansion of the intermediary medium, causing the nominal price of real commodities to skyrocket.
But an increase in the money supply does not cause isolated price spikes like the ones seen in oil.
To understand why, it helps to separate a change in “relative prices” from true “monetary inflation”.
When a specific commodity like oil spikes due to geopolitical conflict — such as the recent naval bottlenecks blocking the Strait of Hormuz — this is a microeconomic supply shock, not a monetary phenomenon.
Friedman’s maxim holds true for sustained, generalized price increases. A geopolitical crisis can make oil expensive overnight. But it only translates into long-term, economy-wide inflation if central banks panic and increase the money supply to help citizens pay for that expensive oil, effectively subsidizing the higher cost with printed currency.
When economic shocks ripple through the economy, causing inflation, the widespread consensus is that central banks should maintain or even raise interest rates.
We wrote about Kevin Warsh potentially lowering rates. We came to the conclusion that as long as the war is on, and Warsh thinks inflation is a microeconomic oil supply shock, we’re not going to get a cut.
Warsh plus Friedman equal lowering rates — Richard Mills
At its June 17 meeting, the Federal Open Market Committee voted unanimously to maintain the Federal Funds Rate target range at 3.50% to 3.75%. This marked the first decision led by new Fed Chair Warsh.
Key policy and economic details:
- Economic Projections: The committee revised its 2026 PCE inflation forecast upward to 3.6%, up from the previous 2.7% projection.
- Rate Path Divide: Although rates were held steady, the new “dot plot” indicates a hawkish shift. Nine of the nineteen officials now anticipate at least one rate hike later in 2026, while the remaining eight expect no change and one projects a cut.
- Policy Guidance: The Fed removed its previous forward-looking language regarding interest rate cuts from the official FOMC Statement.
- Next Steps: The committee will meet next on July 28-29, with updated rate projections scheduled for release on Sept. 16.
The current US inflation rate (CPI) is 3.5%, well above the Fed’s 2% target. If we go by the Fed’s preferred inflation gauge, the Core Personal Consumption Index (PCE), which is a measure of the average increase in prices for all domestic personal consumption, minus volatile food and energy, inflation is 3.4%.
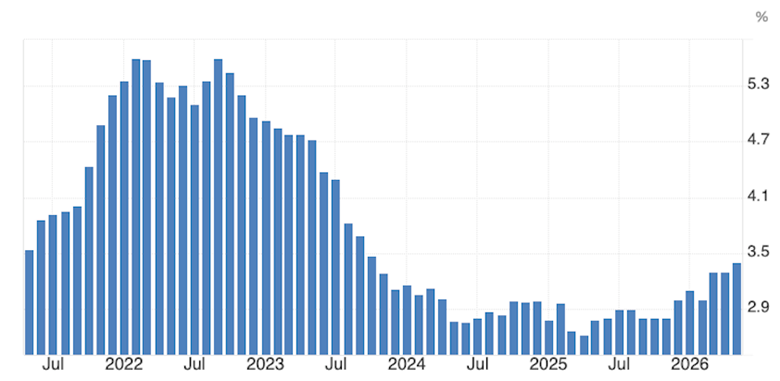
From this five-year chart, notice that inflation peaked in September 2022, at 5.6%, in line with the trend at the time of higher prices due mostly to supply chain disruptions resulting from the post-covid restart of the global economy, but also stimulus payments doled out to Americans during the pandemic that resulted in a hike in consumer spending and therefore inflation.
Core PCE inflation dropped from 5.6% in June 2022 to a five-year low of 2.67% in April 2025 and was 3% in February 2026; the United States and Israel attacked Iran on Feb. 28.
The war and the resulting hike in oil prices due to the closure of the Strait of Hormuz drove inflation up from 3% to the current 3.4%.
The same trend occurs if we use the CPI. US CPI inflation fell from a five-year high of 9.1% in June 2022, to a five-year low of 2.3% in April 2025. From February’s 2.4%, inflation climbed to 3.3% in March and 4.2% in May, before slipping to 3.5% due to expectations of lower oil prices owning to the mid-June ceasefire.
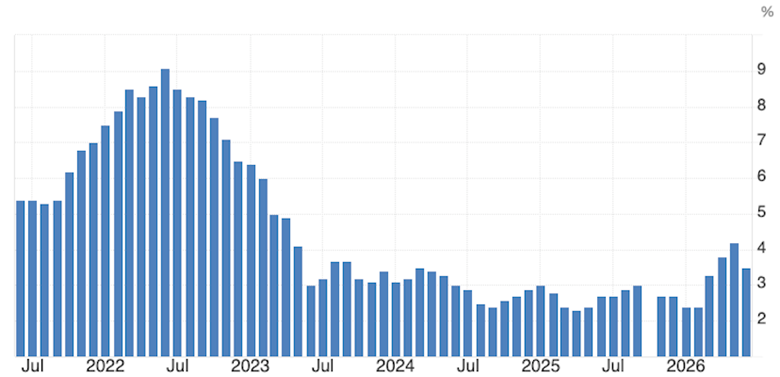
The question is what caused the price rises? It wasn’t money-printing, but the oil price shock that accompanies the war in Iran. Did the US increase the money supply, M2? Yes, but the velocity of money did not increase. Which means it was not out in the economy being spent.
Check out the Brent crude price chart below. The international oil benchmark traded between $60 and$70 a barrel between last August 2025 and the end of February. On Feb. 26 it was $70.00. Two days later the war started. Brent crude shot up to $110 within three weeks. Since then. it’s jumped around a lot, from a one-year high of $112 on May 4 to a one-year low of $66 on July 1.
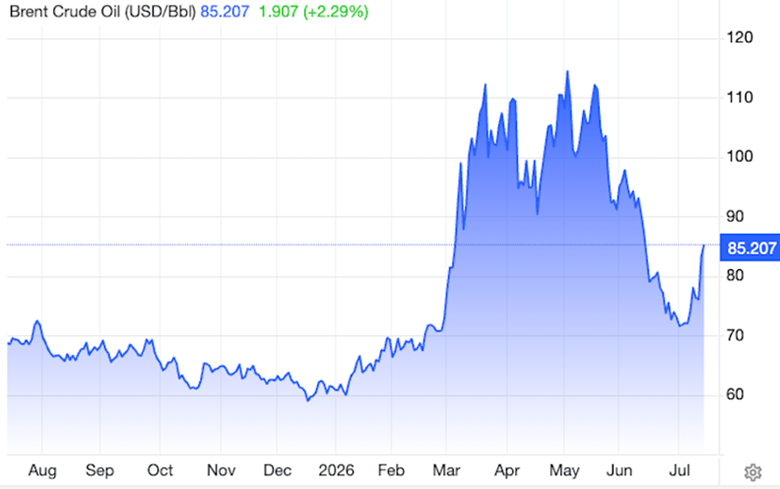
If money doesn’t get out into the economy — like it did during the pandemic — there is no inflation caused by money-printing.
(The US government spent a total of $931 billion on the three rounds of direct covid-19 stimulus payments, officially known as Economic Impact Payments. The payments spanned a period of about 21 months, starting in April 2020 and wrapping up by December 2021.)
We can prove this by looking at the M2 Money Supply and the velocity of money, which is how many times it changes hands in the economy.
According to Trading Economics, United States M2 Money Supply averaged USD$5.7 trillion from 1959 until 2026, reaching an all-time high of $22.8 trillion in April 2026 and a record low of $286 billion in January 1959.
The one-year chart below shows M2 steadily rising from $21.8 trillion in May 2025 to $22.8 trillion in April 2026, an increase of $1 trillion within a year.
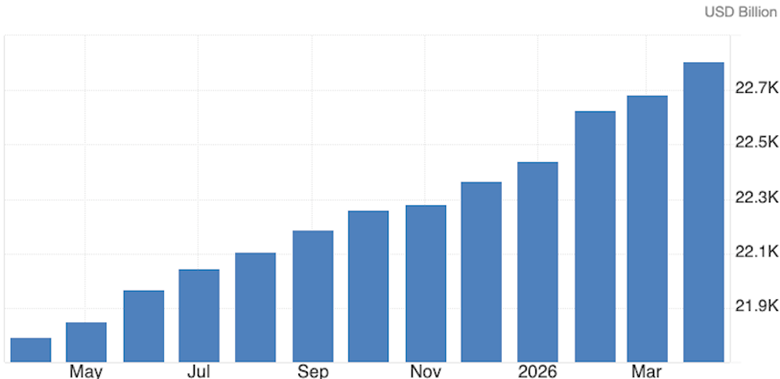
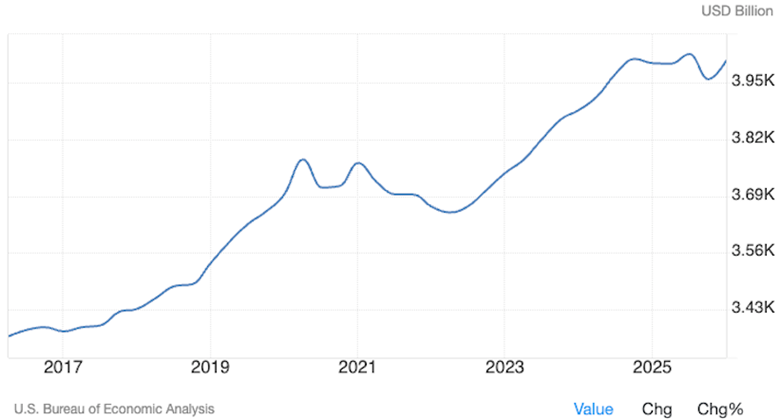
The increase in money supply is the Treasury Department printing money to pay for government expenditures. Government spending has continued to rise through Trump’s first term, Biden’s term and Trump’s second term. In the first quarter of 2021, corresponding with the pandemic, it hit $3.77 trillion compared to $3.38T in Q1 2017. From Q2 2016 government spending has gone from $3.37T to $4T in Q1 2026, an increase of 18%.
The point is that both the Biden administration and the Trump administration 2.0 had beaten inflation. Before the war, in February 2026, CPI inflation was 2.4% and core PCE inflation was 3%. That was Trump 2.0. Biden inherited pandemic-era inflation from Trump 1.0. CPI inflation peaked at 9.1% in June 2022 but by the time Biden left office in January 2025, inflation had dropped by two-thirds to 3%.
Then came the war in Iran, and inflation climbed back up.
A second point is what caused the Fed’s reading of inflation to rise. Was it monetary policy or something else? We can prove that in the last two inflation cycles — the current one and the post-covid one from 2021 to 2024 — the reason for the rise in prices was an economic shock.
If we go back to what happened during the financial crisis of 2007-08, three rounds of quantitative easing (QE) were deployed costing roughly $4 trillion between 2008 and 2014.
(QE is an unconventional monetary policy used by central banks like the US Federal Reserve or the Bank of Canada to stimulate the economy by electronically creating money and buying financial assets such as government bonds.)
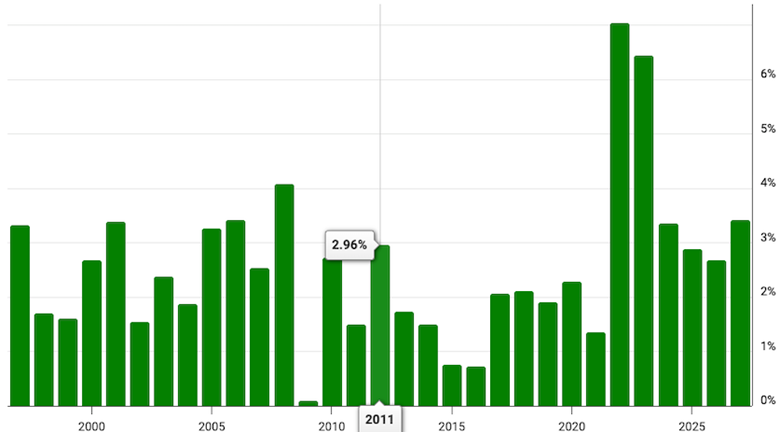
The curious thing about all this economic stimulus is that it didn’t cause inflation. Not really. Why not? Because the economic stimulus created by the government stayed within the banks. It didn’t get out into the economy. A historical inflation chart shows the CPI plunged to 0.09% in 2008 (when the global economy collapsed) but never went above 3% despite three rounds of QE.
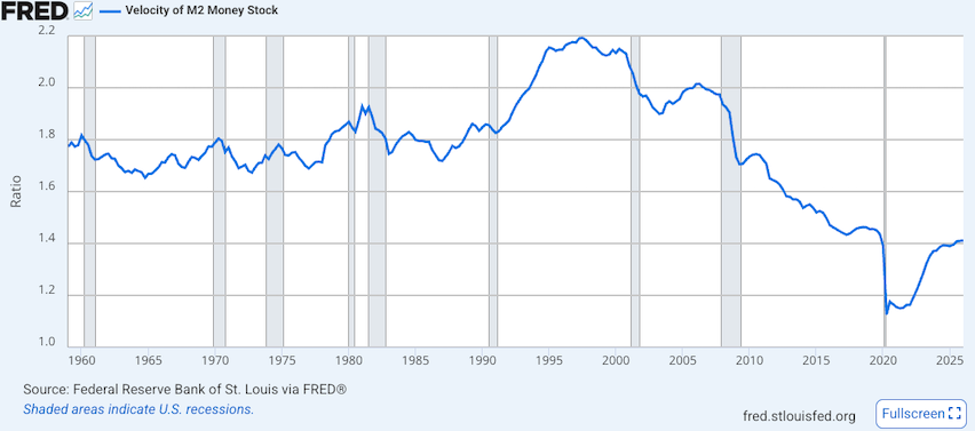
This is also shown by the velocity of money. A historical chart shows it declining for a long time, between 1998 and 2020. It fell sharply between 2007 and 2009, corresponding with the Great Recession.
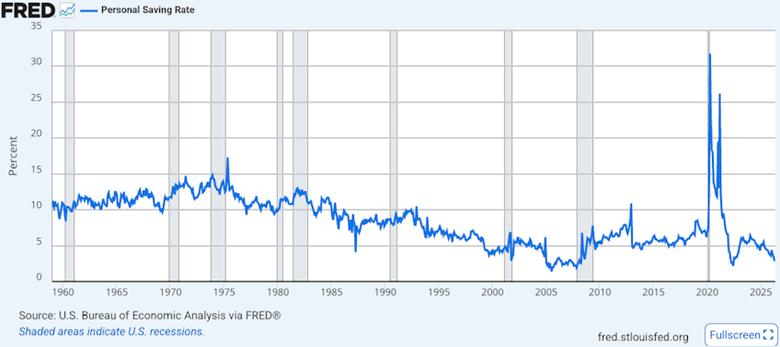
Again, the money created by the government didn’t get into the hands of ordinary citizens. The velocity of money slowed, as did consumer spending. The Personal Savings Rate jumped from 1.9 in November 2007 to 7.8 in May 2009. Unsurprisingly, given the country was in recession.
Fast forward to the covid-19 pandemic. The stimulus checks started with Trump and continued with Biden.
M2 Money Supply shot up, between $15.5 trillion in February 2020 to $21.8 trillion in April 2022 — an historic increase driven by Federal Reserve actions and a massive covid relief package.
By the end of Trump’s term in 2021, the money supply sat at $19 trillion, an expansion of over 40%.
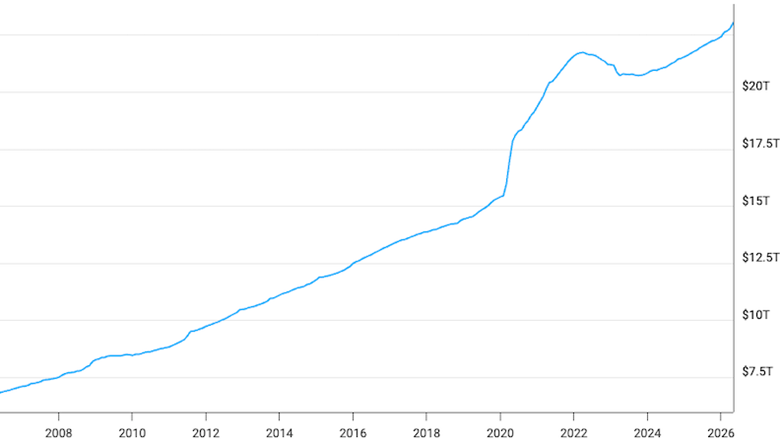
The difference between the Great Recession and the covid recession was the velocity of money. This time it got into the hands of ordinary citizens through the stimmy checks.
All that free money alongside rock-bottom interest rates — the Federal Funds Rate was static at 0.25% between spring of 2020 and spring of 2022 — pushed inflation to a peak of 9% in June 2022.
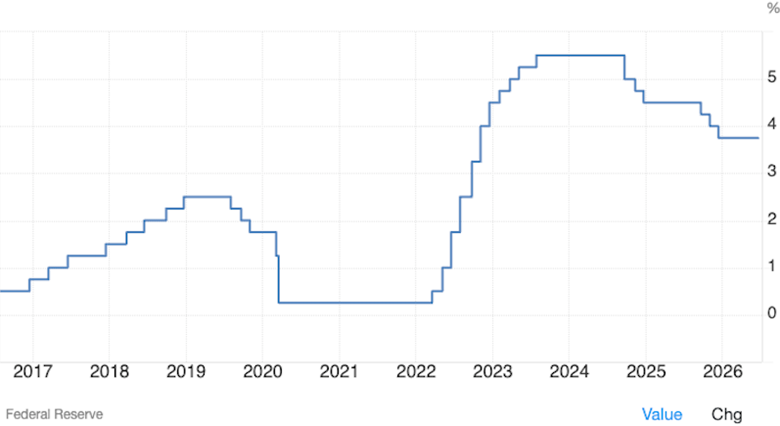
The point is it wasn’t government spending via an increase in M2 Money Supply that caused inflation. It was supply-chain bottlenecks cause by the rapid restart of the global economy following the end of the pandemic.
According to the Bank of Canada, economists widely agree that a combination of these supply bottlenecks and a massive surge in consumer demand drove the price increases.
Velocity of M2 Money Stock climbed 1.126 in Q2 2020 to 1.393 in Q3 2024 before leveling off. The money was getting into the economy.
Look at the Personal Savings Rate during the pandemic. It jumped to a historic high of 31.8% in April 2020, by far the largest percentage going back to 1960 in the chart above.
But the savings rate declined over the course of the Biden administration as consumers ran down their pandemic buffers.
By the end of 2024, the rate hovered between 4.3 and 4.8%.
Also, rapidly rising inflation made it difficult for people to save.
Now let’s consider the current Trump administration. We have an increase in M2 Money Supply due to crazy government spending. M2 has gone from $21.5 trillion in January 2025 to the current $23 trillion.
Friedman’s dictum says that inflation is always a result of money-printing. Well, not always, as we are seeing.
US CPI inflation has gone from 3% in January 2025 to 4.2% in May 2026. June’s rate of 3.3% is the lowest since March when the war started.
But this current war and oil price-driven inflation is different from the post-covid inflation caused by supply chain bottlenecks. Both are economic shocks, true.
The difference is reflected in the velocity of money, the savings rate and the amount of household debt being accumulated.
First let’s look at the savings rate. In May 2025 it was nearly 5%. By January 2026 it was 4.4%, and it kept falling to 3% in April, before leveling off. While it’s risen from June 2022 — the high point of post-covid inflation — it remains far below the long-term historical US average of roughly 8.5%, prompting economists to closely monitor increasing household reliance on credit to manage living costs.
Translation? Inflation is back on, after both Trump and Biden beat it, Americans are saving less and putting more expenses on credit.
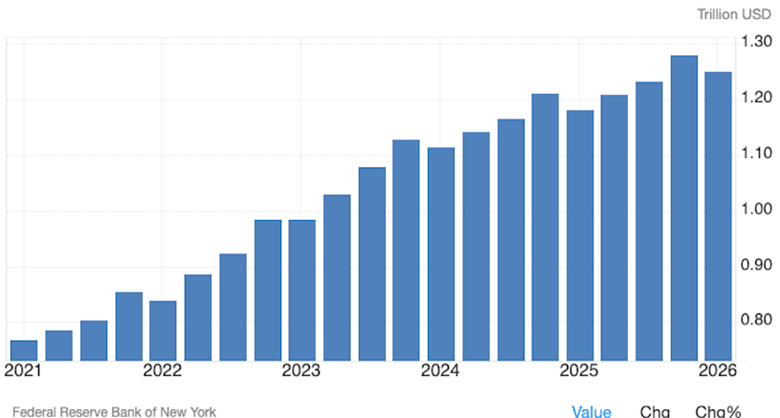
US credit card debt has climbed steadily since 2021, when it was less than a trillion dollars, to the current $1.25T in the first quarter of 2026.
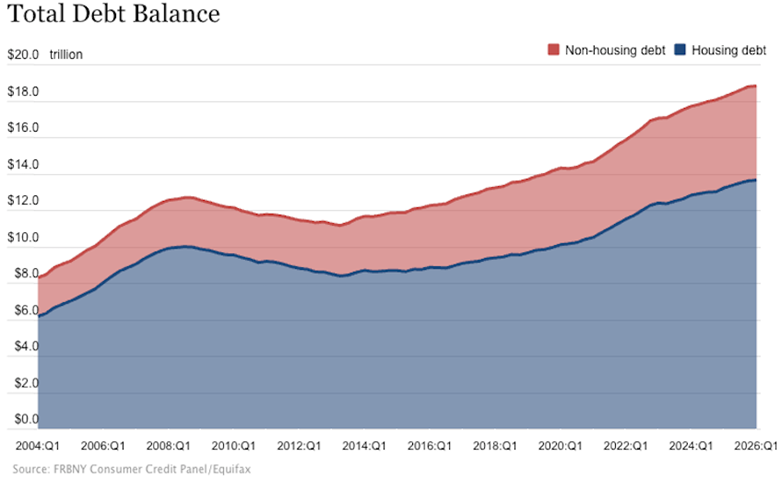
More alarming is household debt. It’s gone from $17 trillion in Q1 2023 to the current record $18.8 trillion.
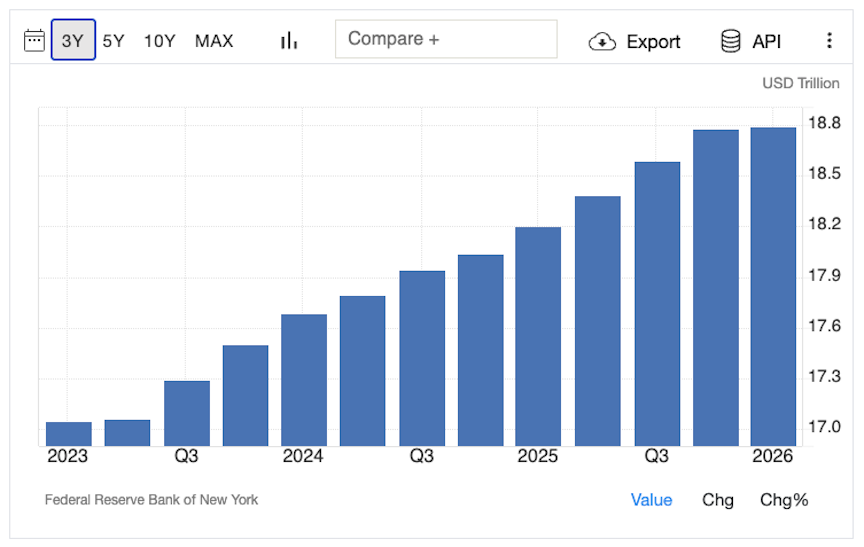
The chart below by the New York Fed shows housing and non-housing debt rising steadily since 2013.
Now let’s look at the velocity of money. Remember it increased under Biden, but it has flattened under Trump 2.0. Why did money get into the economy and change hands more often under Biden than Trump? Well, under Biden we had stimulus checks being distributed and cashed. The economy was doing well and that caused people to save less and spend more.
In 2026 we have a different story. From Q1 2025, Velocity of M2 Money Stock has barely budged from 1.39 to 1.41. Remember, it climbed 1.126 in Q2 2020 to 1.393 in Q3 2024.
Again, we ask the question: Is government money-printing causing inflation or not? Imo, the answer is no. All the money that’s been printed is not getting out into the economy and being spent. We see this by the lack of savings, the high credit card and household debt, and the stalled velocity of money.
The stall is primarily driven by three factors:
- Cash Hoarding: Consumers and businesses frequently park their capital in savings or high-yield money market funds rather than spending it directly into the real economy.
- Wealth Accumulation: Expanded central bank liquidity (like quantitative easing) has inflated asset prices, but this wealth is largely held by segments of the population whose spending habits remain stable regardless of paper gains.
- Abundant Reserves: Under the modern monetary framework, holding money is increasingly cheap. People and institutions view currency as a store of value, making them equally indifferent to holding money or bonds during cooling economic periods.
Conclusion
What do these insights tell us about the direction the Federal Reserve is going under new Chairman Kevin Warsh?
As long as the war is on, and Warsh thinks inflation is an economic supply shock, we’re not going to get rate cut. Instead, we are likely to have a succession of holds until the Fed gets clarity on the war.
As we wrote in a previous article, Warsh prefers to focus on “trimmed-mean” inflation metrics rather than the broader Consumer Price Index (CPI) or Personal Consumption Expenditures (PCE). He argues that trimmed averages better filter out one-time price shocks — such as those caused by geopolitical events or tariffs — to reveal the underlying inflation trend.
Imagine excluding oil prices from the current inflation index.
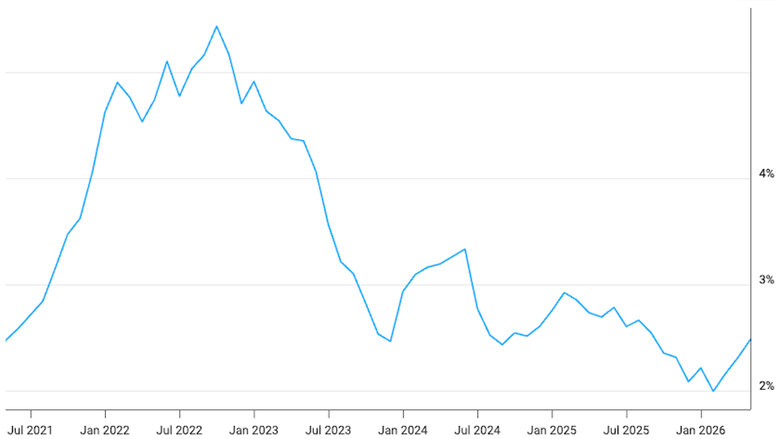
Core PCE removes all food and energy prices every month. In contrast, Trimmed Mean PCE excludes any spending categories with the most extreme price increases or decreases in a given month. It filters inflation by the size of the price move rather than by specific category. What Warsh refers to as economic price shocks such as the closure of the Strait of Hormuz.
The Trimmed Mean PCE inflation rate in the graph below, the one favored by Warsh, shows inflation a lot lower than the CPI and PCE price indices. From 5.4% in October 2022 to the current 2.4%, versus 6.4% to 3.4% during the same period for the CPI.
Warsh is right to see the current inflation as the result of an economic shock rather than monetary policy. Say we didn’t have these shocks — like covid and the war with Iran. Rampant money-printing to fund out-of-control government spending would cause hyperinflation, especially if it gets into the economy and consumers spend it, like they did during the post-covid inflation era.
But that’s not what’s happening. Inflation is back, but it’s subdued. Money is being printed but it’s not getting out into the economy, into the hands of consumers. Household savings has plummeted and Americans are more indebted than ever.
Interest rates are on hold until there is a resolution to the war. There will be a raise if the war induced price shocks become permanent. But, the Fed is finally dropping it’s Greenspan induced, Bernanke and Powell followed New Keynesian thinking. Warsh is a Monetarist.
Tit for tat attacks between the Houthis and Saudi Arabia have just taken place. If the Houthis close the Strait of Bab-el-Mandeb over a third of the world’s seaborne oil will be stuck in ports or at anchor in two straits.
If Mandeb and Hormuz are closed, global markets would lose access to a vast array of vital non-energy commodities. Essential goods stuck behind these chokepoints would include liquefied petroleum gas(LPG), naphtha, jet fuel, industrial inputs like methanol, sulfur, and graphite, as well as refined metals like aluminum and agricultural fertilizers.
A dual shutdown of these routes would force vessels to detour around the Cape of Good Hope, adding 10 to 14 days to shipping schedules and severely spiking insurance and freight costs.
A closure of the South China Sea and the Taiwan Strait would disrupt over $6.4 trillion in global trade. Besides chips, the supply of energy (oil and LNG), rare earth minerals, chemical inputs, automotive parts and retail goods would be critically impacted.
China might soon control 70% of the world’s seaborne trade, if they don’t already.
Richard (Rick) Mills
aheadoftheherd.com

Legal Notice / Disclaimer
Ahead of the Herd newsletter, aheadoftheherd.com, hereafter known as AOTH.Please read the entire Disclaimer carefully before you use this website or read the newsletter. If you do not agree to all the AOTH/Richard Mills Disclaimer, do not access/read this website/newsletter/article, or any of its pages. By reading/using this AOTH/Richard Mills website/newsletter/article, and whether you actually read this Disclaimer, you are deemed to have accepted it.