Why copper, silver and gold? – Richard Mills
2025.12.31
2025 was historic in that gold, silver and copper all rose significantly at the same time — the first time this has happened in 45 years.
With one trading session to go before 2025 is in the books, gold has gained 69% to $4,331.90 an ounce. Silver more than doubled gold’s YTD increase to rise 157% to $72.25/oz, Monday afternoon, after hitting a new record-high of $83.62 on Dec. 28 after China, the world’s second largest silver producer, said it would restrict silver exports in 2026.

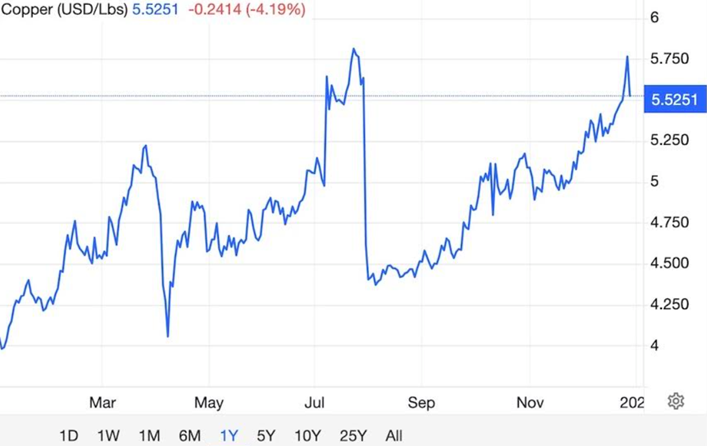
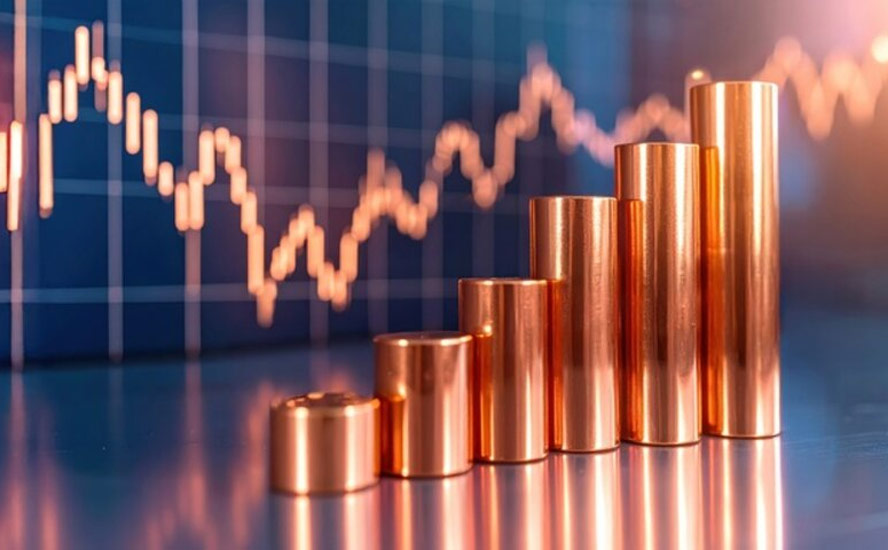
Copper also hit never-before-seen prices this year, adding 42% or $1.64 a pound since Jan. 2 to reach $5.52 on Monday the 29th. Earlier in the trading session it hit a new record-high $5.86.
Respected precious metals analyst Adam Hamilton observed that, after slumping badly a year ago, 2025 was the year that PM mining stocks finally caught up with soaring gold and silver prices. Hamilton references the huge gains in gold miner and junior gold miner ETFs GDX and GDXJ, and notes that silver bested even Nvidia in 2025:
With the book about to close on 2025, GDX and GDXJ have skyrocketed an extraordinary 163.9% and 177.3% year-to-date as of Christmas Eve! Those colossal gains amplified gold’s huge 70.7% YTD by a far better 2.3x and 2.5x, reflecting wildly improved mainstream psychology. That spilled into silver and platinum too, which have also skyrocketed an epic 148.9% and 148.2% YTD!
Don’t skim over those phenomenal results without giving them time to sink in. The S&P 500 had a good 2025 too but merely rallied 17.9% YTD. Dominant AI market-darling NVIDIA had a great year but is just up 40.4% YTD.
The Hindustan Times wrote on Dec. 29 that silver’s market capitalization of $4.65 trillion is now more than NVDA’s (NASDAQ:NVDA) $4.58 trillion.
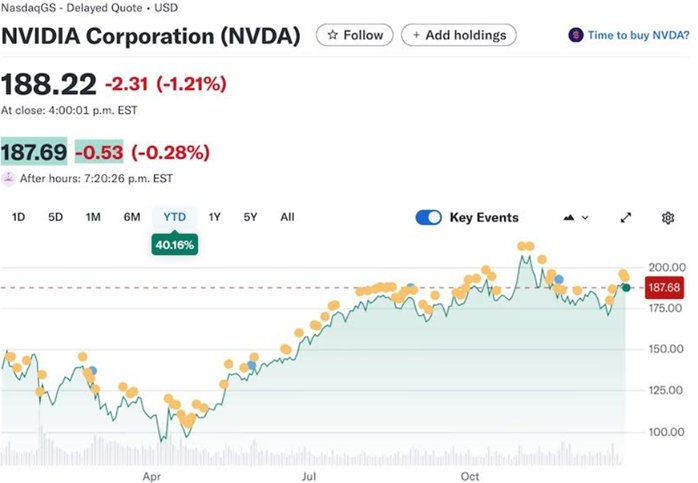
The publication said it marks the first time in the modern digital era that an industrial commodity has overtaken the world’s premier technology company, trailing only gold in global asset rankings.
Gold
Gold rocketed higher due to a combination of factors, including safe haven demand arising from numerous geopolitical hot spots — Gaza, Ukraine, and recently, Venezuela — a lower US dollar which is always good for metals prices; central bank buying; robust gold-backed ETF inflows; a cooling US labor market; and the prospect of the Fed lowering interest rates further next year.
There are also structural supply constraints on gold, silver and copper. AOTH research has found that for all three metals, for the past several years, supply can’t meet demand without recycling.
As mentioned, a big part of gold’s success story is due to central bank buying.
The BRICS countries are moving away from the US dollar as the currency that settles international transactions, and gold is an integral part of the new settlement mechanism.
BRICS launch gold-backed global currency — Richard Mills
On Oct. 31, 2025, researchers launched a pilot to test a gold-anchored settlement “Unit” inside the 10-member BRICS+ bloc of countries, which includes Brazil, Russia, India, China, South Africa, Egypt, Ethiopia, Indonesia, Iran, and the United Arab Emirates.
There are several reasons why the BRICS created the Unit to trade without the dollar. Members face sanctions, high dollar borrowing costs, and volatility tied to US monetary policy.
The Unit would allow them to settle trade without using US banks; store value using gold instead of foreign currency reserves; reduce exposure to dollar liquidity shocks and build a monetary framework independent of Western systems.
Macro trends driving the initiative include US deficit spending, with heavy borrowing raising doubts about the dollar’s long-term strength; geopolitical fragmentation, with rival blocs seeking options beyond dollar-based systems; elevated inflation which is pushing capital into more stable assets; declining purchasing power, with many currencies losing value faster than wages or savings can keep up; and rising gold demand, with central banks continuing to increase their reserves.
The BRICS want to set up a new currency due to aggressive US foreign policies, including the US placing sanctions on Russia and Iran. The two countries are reportedly working together to bring about a BRICS currency that would negate the economic impacts of such restrictions.
In parallel, Russia and China now settle almost all of their bilateral trade using the yuan and the rouble, while local currencies dominate transactions across the Eurasian Economic Union.
The BRICS want to better serve their own economic interests while reducing global dependence on the dollar and the euro. Russian economist Yevgeny Biryukov, said, “For BRICS countries, gold is a tool to protect against sanction risks, a response to the unreliability of traditional partners, and a tangible asset recognised for thousands of years.”
Central banks bought more than 1,000 tonnes of gold per year from 2022-24, making it the longest sustained gold-buying period in modern history. The majority of these purchases came from non-western emerging markets, while China, Turkey, India, and Poland, have been the primary drivers of this trend.
IDN Financials says the alliance now controls about 50% of global gold production through a combination of output from member states and strategic partners. Russia and China are the main drivers of this strategy, with China in 2024 producing 380 tonnes and Russia 340 tonnes.
“This large-scale production ensures that BRICS holds significant control over the world’s physical gold supply.”
The combined official gold reserves of member states now exceed 6,000 tonnes, with Russia leading at 2,336 tonnes, followed by China with 2,298 tonnes and India with 880 tonnes. Brazil added 16 tonnes in September 2025—its first purchase since 2021—bringing its total reserves to 145.1 tonnes. This dual strategy of high production alongside the accumulation of strategic reserves positions BRICS as both a key supplier and a major influence in the physical gold market.
Between 2020 and 2024, central banks of BRICS member states purchased more than 50% of global gold, systematically reducing their reliance on dollar-denominated assets.
The Unit is the answer to countries facing inflation, weak currencies and rising debt. They are moving toward assets that hold real value and are using gold to support trade between BRICS nations.
The Unit makes gold part of daily settlement, not just storage, thereby shifting the role of metal from a passive reserve to an active trade asset.
Additionally, the design can strengthen gold’s position in global finance based on the following elements:
- Gold becomes a tool for government-level transactions
- BRICS members need more gold reserves to issue more Units
- Expansion means more consistent gold buying
- Gold moves through trade and not only vaults.
As a result, the Unit marks a shift in how value moves across borders. While still a pilot, it brings gold back into the spotlight as more than a hedge. It becomes part of the global trade system.
Silver
The silver market continues its longest streak of supply deficits in recent years, with the 2025 World Silver survey noting 2025 is the fifth straight year of supply not meeting demand. Mine production has fallen to 813 million ounces, unable to keep pace with surging demand mostly from industrial (but also monetary) applications.
Kitco ran a column by Kitco regular Gary Wagner headlining that gold and silver’s real story lies in Comex trading volume.
Wagner wrote on Dec. 17 that silver futures trading volume has reached approximately 145,000 contracts, remarkably close to gold’s 200,000 contracts.
This is highly unusual, given that historically, gold futures have dominated precious metals trading by a wide margin, with silver futures volume normally trading at a fraction of gold futures volume.
The ratio is often 3:1 gold futures over silver futures, however the current ratio is less than 1.4:1.
This, writes Wagner, “represents a dramatic shift that market participants are noting as a key indicator of silver’s emerging importance in the investment landscape. The elevated silver futures activity reflects not only speculative interest but also significant hedging demand from industrial users concerned about supply availability. When futures volume ratios shift this dramatically, it often signals a fundamental change in market structure rather than mere short-term speculation. The compression in the volume differential suggests that silver is increasingly being treated as a macro asset, rather than simply as gold’s volatile counterpart.
“Silver’s rally this year is also supported by tightening inventories and robust retail and industrial demand, particularly from the expanding solar, electric vehicle, and data center sectors. The renewable energy transition has emerged as a critical driver, with photovoltaic solar panel manufacturing consuming record quantities of the conductive metal.”
Wagner also mentions the narrowing gold-silver ratio — how many ounces of silver it takes to buy one ounce of gold. At times over the past few years at the 80s and 90s level, due to the discrepancy between surging gold and rangebound silver, the ratio has dropped from its 2020 peak of 108 to the current 59 — the compression mainly due to the higher percentage increase in silver prices compared to gold prices.
According to Wagner,
The post-1971 average gold-silver ratio is around 66, with prior silver bull runs seeing that figure drop below 40. If historical patterns repeat, silver could see substantial further appreciation relative to gold, potentially justifying analyst forecasts for $100 silver in 2026.
The Telegraph says silver is set for its best year since 1979. From Jan. 1st 2026, China will require exporters of silver, tungsten and antimony to obtain licenses from the Ministry of Commerce.
Hamilton wrote earlier this month that silver reached a near-parabola, referring to the upside-down U-shaped curve in geometry. You can see what Hamilton means in the below one-month silver chart.
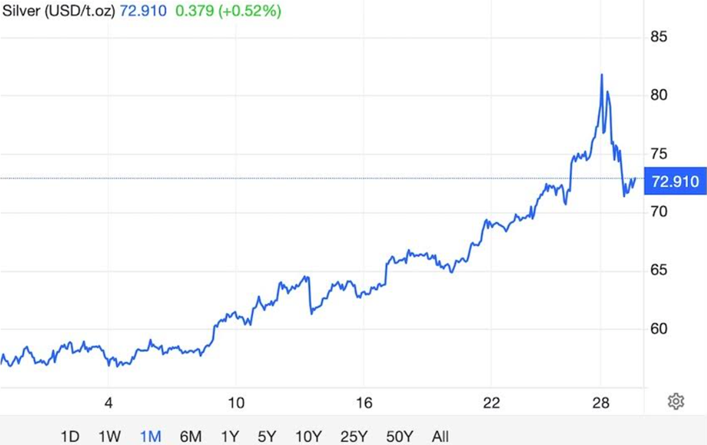
He notes silver gained 37.5% in 2.8 months to mid-October, then another 42.2% from late October to mid-December, leveraging gold’s simultaneous 8.8% rally by a fantastic 4.8x! That has boosted silver’s entire bull gains since late 2023 to 217.1%, 1.6x better than gold’s over that same span. Adding to recent excitement, silver has forged 15 new all-time-record nominal closes since early October. Yet inflation-adjusted real silver remains far under January 1980’s peak.
(the last time silver formed a parabola to hit a then-record $48/oz)
Crescat Capital’s Tavi Costa says “This is the year silver stepped firmly into the leadership position it has historically taken during powerful, long-term bull markets,” posting on X a silver-to-S&P 500 ratio chart that in his opinion is a clear blueprint to the path ahead.
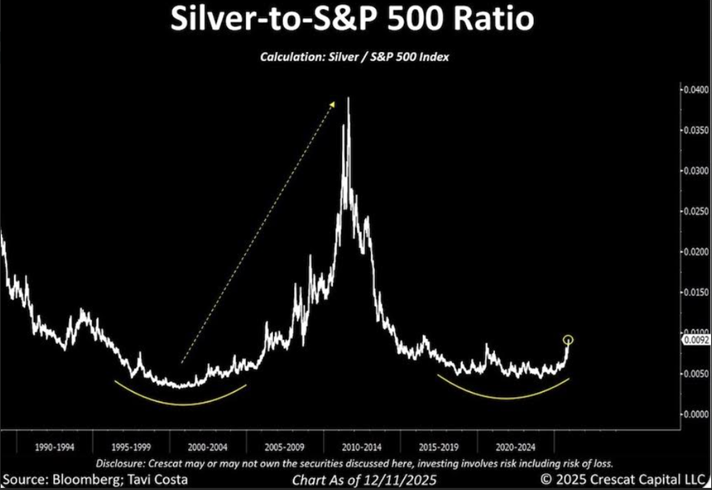
He further states “This looks like the start of a new regime — one defined by structurally higher prices in an over-indebted world where inflation remains the path of least resistance for policymakers.
“Volatility will be part of the journey, but a return to a low-price metals environment anytime soon should not be the base case in my view.”
Copper
Copper is on course for its biggest annual price since the recovery that followed the 2008 financial crash, states the Guardian, as traders react to fears of global shortages.
The electrification metal has jumped 42% this year. One reason for copper’s stellar performance, apart from shortage jitters stemming from high-profile temporary mine closures such as the Grasberg mine in Indonesia and the Kakula mine in the DRC, is US tariff uncertainty.
Copper earlier this year flowed to the United States as shippers sought to avoid a threatened tariff on the metal. Though the 50% tariff on semi-finished copper products was later suspended, the hoarding effect has limited supplies in other parts of the world and helped drive global prices higher, the Guardian stated on Dec. 29.
Armstrong Economics disputes the copper hoarding notion, arguing that the real driver of copper prices is fear:
When people begin hoarding raw materials, it means they no longer trust supply chains, governments, or currencies…
Once politicians declare something “critical,” it ceases to be a free market. Governments are now talking openly about stockpiling copper for green energy, military use, and infrastructure. That alone guarantees shortages, because bureaucrats always buy at the worst possible time and hoard at the peak. Trade wars, sanctions, and geopolitical uncertainty force companies to hold excess inventory to hedge against supply chain constraints…
Capital always moves to where it feels safest. When confidence in government collapses, money does not stay in bonds or paper promises. It moves into real assets, whether that is gold, land, energy, or copper sitting in a warehouse.
The Guardian makes two more interesting points about copper, silver and gold:
- Analysts said copper had also joined silver and gold as a safe haven asset for investors wanting to hedge against the falling value of the dollar.
- Kyle Rodda, a senior financial market analyst at the investment company Capital.com, said the rise of copper, gold and silver demonstrated “a world marked by greater scarcity and investors’ desire to get their hands on things with relatively limited supply”.
Along with all the usual applications for copper — in construction, transportation and telecommunications — demand is being driven by on-going electrification and decarbonization of the transportation system and the exponential growth in battery storage.
This all boils down to everything driving the world’s economies needs more copper, in the face of persistent constraints on mine supply.
Mine disruptions like the recent Grasberg mine mud intrusion in Indonesia, and the flooding at Ivanhoe Mines’ (TSX:IVN) Kakula mine in the Congo not only strip copper supply from the global market and drive up the price but they also highlight just how volatile the copper market is when one mine closure and then another leaves it vulnerable to price spikes from any supply disruption or demand surge.
There has been a dearth of new copper discoveries in recent years, and the grades of existing copper mines are dropping, which, when added to operational misses, are making the supply problem worse.
The problem is the low-hanging fruit’s been picked. It’s very hard to get a large new discovery of over 200,000 tonnes a year.
There are few new copper mines being built and the ones that are usually have offtakes with Asian countries, not Western ones.
A big variable is demand from data center growth, which could translate into a 30% increase in copper demand by data centers next year, writes Gregory Shearer, head of base and precious metals strategy at JPMorgan, via Axios.
At U.S. Global Investors, Frank Holmes writes A conventional data center uses between 5,000 and 15,000 tons of copper.
A hyperscale data center, on the other hand—the kind being built to run artificial intelligence (AI)—can require up to 50,000 tons of copper per facility, according to the Copper Development Association…
Data centers currently consume about 1.5% of global electricity supply, roughly the same amount as the entire U.K., according to the International Energy Agency (IEA). The organization believes that, by 2030, demand will more than double, with AI responsible for much of the increase. That means data centers could be consuming more than half a million metric tons of copper annually by the end of the decade.
Perhaps even more significant is Holmes’ remark that data centers are largely indifferent to copper prices. Despite the amount of copper in data centers, the cost is low. According to Wood Mackenzie, the metal accounts for just 0.5% of total project costs. That means data centers will be built whether copper is trading for $10/lb or $20/lb.
The International Energy Agency (IEA) believes that, by 2030, demand will more than double, with AI responsible for much of the increase. That means data centers could be consuming more than half a million tonnes of copper annually by the end of the decade.
An additional half-million tonnes doesn’t seem like a lot, but it will stretch miners to find that extra copper. Global mined copper production is about 22 million tonnes a year, but a shortfall of 30% is expected by 2035.
S&P Global produced a report in 2022 projecting that copper demand will double from about 25 million tonnes in 2022 to 50Mt by 2035. The doubling of the global demand for copper is expected to result in large shortfalls — something we at AOTH have been warning about for years.
The copper market is expected to face its most severe deficit in 22 years in 2026 —590,000 tons — according to Morgan Stanley.
The deficit could widen by 2029 to a whopping 1.1 million tons.
M&A
According to the International Energy Agency, via Reuters, the capex required to get new supply up and running in Latin America, the nexus of global copper production (Chile, Peru), has increased 65% since 2020.
To build a new 200,000-ton-a-year copper mine, the upper end is $6 billion.
That implies up to $30,000 to build one ton of yearly copper production, a figure miners are not, so far, buying into.
It’s easy to see why miners are reluctant to build new mines and are instead relying on M&A to increase their reserves.
Mining and metals remained the focal point of public M&A in Canada in 2025, accounting for approximately 37% of overall public deal activity as of September 30, 2025.
Deal values surged in the first half of 2025, reaching approximately C$113.7 billion across all sectors, reflecting a focus on fewer, larger, and more strategic transactions.
The high volume and value of deals were driven by record-breaking gold, copper and silver prices, a “buy vs. build” mentality among major producers, and a more efficient regulatory environment in Canada:
- Discovery Silver (TSX:DSV) acquired the Porcupine Mining Complex in Ontario for $425 million, including cash, shares, and deferred payments.
- In March 2025, Orla Mining (TSX:OLA) purchased the Musselwhite gold mine in Ontario for $850 million.
- South Africa’s Gold Fields (NYSE:GFI) launched a A$3.7 billion (US$2.39 billion) acquisition of Australia’s Gold Road Resources.
(NYSE:BHP) and Lundin Mining (TSX:LUN) did a $38 billion joint venture to expand the Filo del Sol Project in Chile/ Argentina, and MMG (HKEx:1208) acquired Cuprous Capital to expand the Khoemacau copper mine in Botswana.
- Coeur Mining’s (NYSE:CDE) CA$2.3 billion cash-and-stock takeover of SilverCrest that folds the Las Chispas low-cost silver-gold mine into Coeur’s portfolio.
- The Equinox Gold (TSX:EQX) / Calibre Mining merger is a US$2.5 billion all-share transaction that forms an Americas-focused gold company expected to produce about one million ounces of gold per year.
- AngloGold Ashanti (JSE:ANG) and Centamin’s US$2.5 billion cash-and-share acquisition brings the flagship Sukari gold mine under AngloGold’s control.
- Strategic stake increase by Lundin Mining to 70% in SCM Minera Lumina Copper Chile’s, high-grade, long-life Caserones copper mine.
- Zijin Mining bought Newmont’s open-pit Akyem gold mine operation for US$1 billion.
- Codelco and Anglo American (LSE:AAL.L) in September finalized an agreement to merge operations at their Los Bronces and Andina copper mines.
- A merger between London-listed mining company Anglo American and Canadian miner Teck Resources (TSX:TECK.A & B), forms a new global critical minerals company named Anglo Teck. The all-share deal is valued at approximately US$53 billion. The deal combines major copper mines like Teck’s BC Highland Valley Copper (HVC) and Anglo’s Chilean assets, creating a top-tier global copper producer with long-life, low-cost mines.
- On Christmas Day, Chinese state-owned miner Jiangxi Copper acquired London-listed SolGold for $1.2 billion, taking control of the Cascabel gold-silver mine in Ecuador.
- End-of-year M&A also included the acquisition by Coeur Mining of New Gold, which owns the New Afton copper-gold mine in southern British Columbia and the Rainy River gold-silver mine in Ontario. One source said the combined company will have seven operations, which Coeur Mining (NYSE:CDE), expects will produce 20 million ounces of silver, 900,000 ounces of gold and 100 million pounds of copper.
Conclusion
In the new critical minerals age, every mineral is critical, writes Reuters metals columnist Andy Home. What Home means by that, is the US Geological Survey’s updated critical minerals list now encompasses 60 materials representing around 80% of all mined commodities on the periodic table.
Take the production of semiconductors, the technology behind laptops, cell phones, cars, and now, artificial intelligence. Silicon is the material used for semiconductor wafers, but it is limited for advanced computing applications. Add gallium and germanium, and the chip’s capacity rises exponentially. The finished product also contains a mix of palladium, arsenic, iridium, titanium, copper and cobalt.
These materials also have important military applications. According to Home, “Super-powerful gallium nitride chips enhance radar capability and boost drone-jamming capacity, a major defence priority in an age of drone swarms.”
And the competition from these metals to get funded for further exploration, development and mining is going to butt up against the existing deficit in copper, gold and silver as more resources are also put towards their supply.
With demand surging for all these different minerals, mines depleted, depleting or lacking, the M&A cannot continue for much longer. Sooner then later, there will be a huge surge of miners making upstream transactions, with juniors.
And prices for these minerals are going to have to go higher, only by maintaining, and holding, well above incentive pricing for a significant period of time will mines be built. The incentive price for copper is the minimum market price needed for mining companies to justify investing in new, large-scale mining projects or to significantly expand existing production. It represents the cost threshold required for a project to be economically viable, ensuring a specific return on investment.
The wave of M&A currently sweeping across miners will trickle down the food chain and eventually reach juniors. In my opinion it’s just a matter of time until the last few miners left standing realize they’ve locked up the last of the world’s mining reserves amongst themselves. When they do, it’s going to be a mad scramble to lock up as much junior mining company resources as they can.
After all, it’s the juniors who currently own the world’s future mining reserves.
Richard (Rick) Mills
aheadoftheherd.com

Legal Notice / Disclaimer
Ahead of the Herd newsletter, aheadoftheherd.com, hereafter known as AOTH.Please read the entire Disclaimer carefully before you use this website or read the newsletter. If you do not agree to all the AOTH/Richard Mills Disclaimer, do not access/read this website/newsletter/article, or any of its pages. By reading/using this AOTH/Richard Mills website/newsletter/article, and whether you actually read this Disclaimer, you are deemed to have accepted it.


