Silver continues to climb on investment demand, need for 5G and solar

2020.07.05
Precious metals are among the best places to park your money in times of economic or political distress.
Gold and silver offer stability during a period of extreme stock market volatility and low bond yields, and while they do not pay interest or dividends, they are not subject to inflation like paper currencies.
It is also, in my opinion, a smart strategy to allocate a portion of gold and silver to your investment portfolio, knowing that precious metals can be used as a “fail-safe” currency in the event of a total financial collapse.
Early uses
Historically, it was silver’s natural beauty that attracted interest. It’s no accident that silver’s atomic symbol, Ag, from the Latin argentum, is taken from the Greek word for shiny.
The first silver mining began around 3000 BC in what is modern Turkey. Inhabitants began fashioning ornaments and jewelry out of silver ore, and crafting utensils, noticing silver’s anti-bacterial properties.
About 700 BC silver started being used as a currency – a role it has maintained in nearly every ancient and modern culture. About 85% of the world’s silver came from mines in Bolivia, Peru and Mexico between 1500 and 1800.
The drachma coin of ancient Greece, the Roman denarius and British pound sterling all contained a percentage of silver.
Rarity
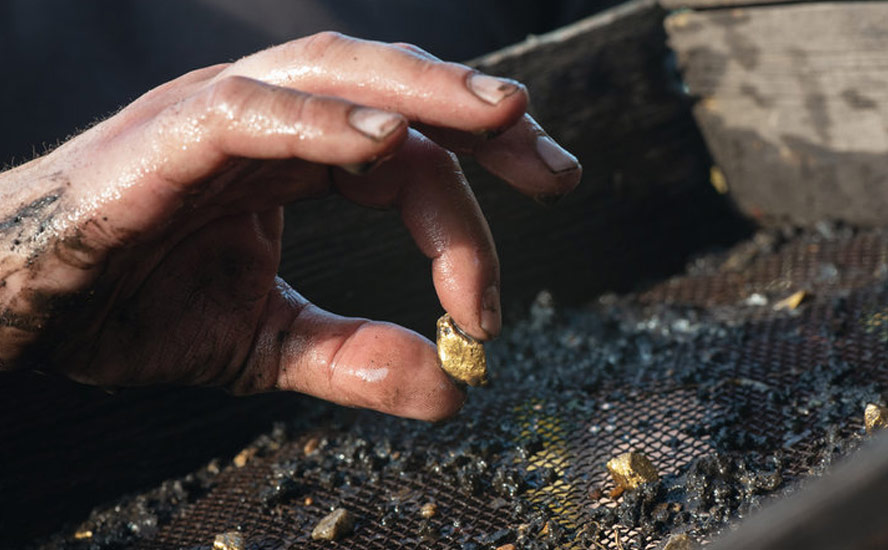
“Native silver” found in the earth’s crust on its own, is relatively rare. More commonly, it is mined alongside gold, or as a by-product of zinc-lead ore.
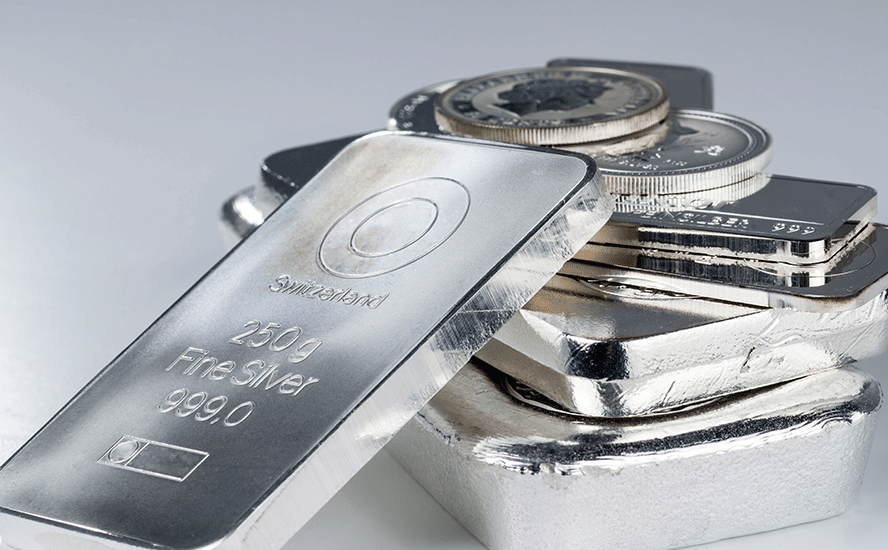
Like gold, silver comes in various purities. The purest is .999 fineness, however this 99.9% silver is considered too soft for making jewelry. To strengthen it, jewelry designers add harder metals like copper, creating “sterling silver” (92.5% silver and 7.5% copper). Many jewelry consumers prefer sterling silver to gold for its polished look, weightiness and durability.
The rarity of both precious metals becomes apparent when we consider how little gold and silver have been mined throughout history – just 190,000 tonnes of gold and 1.6 million tonnes of silver. Or in ounce terms, 6.1 billion oz of gold and 51.3 billion oz of silver. All the gold ever mined in the world could fit into a cube 21.6 meters on each side, and all the above-ground silver could fit into a 52m cube.
While most of the mined gold is still around, either cast as jewelry, or smelted into bullion and stored for investment purposes, the same cannot be said for silver. It’s estimated around 60% of silver is utilized in industrial applications, leaving only 40% for investing. Of the 60% used for industrial applications almost 80% ends up in landfills.
Despite silver being about 17.5 times more plentiful than gold in the Earth’s crust, silver and gold have roughly the same amount, ~2.5 billion ounces, available for investment purposes. However, since very little gold is used by industry, it trades as an investment commodity – prices moving up and down in relation to factors like the US dollar, inflation, interest rates and sovereign bond yields.
In comparison, silver commands a relatively small amount for investment, just 40% of supply. Because over half of supply is needed for industrial applications, silver trades more like an industrial metal than an investment commodity.
This also explains silver’s volatility. Because the investment market for silver is so small (60% is locked up in industrial uses) prices swing up and down wildly, at relatively low volumes. For this reason, investors nicknamed silver “the devil’s metal”.
Applications
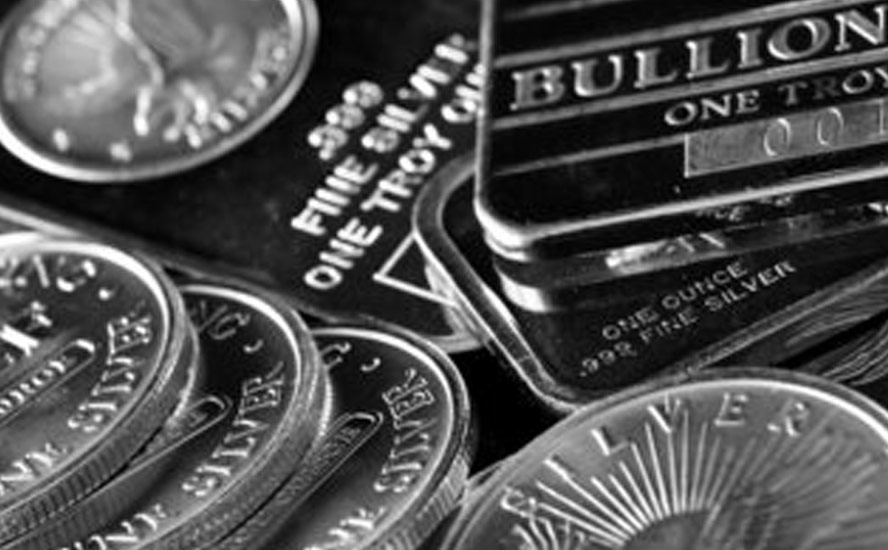
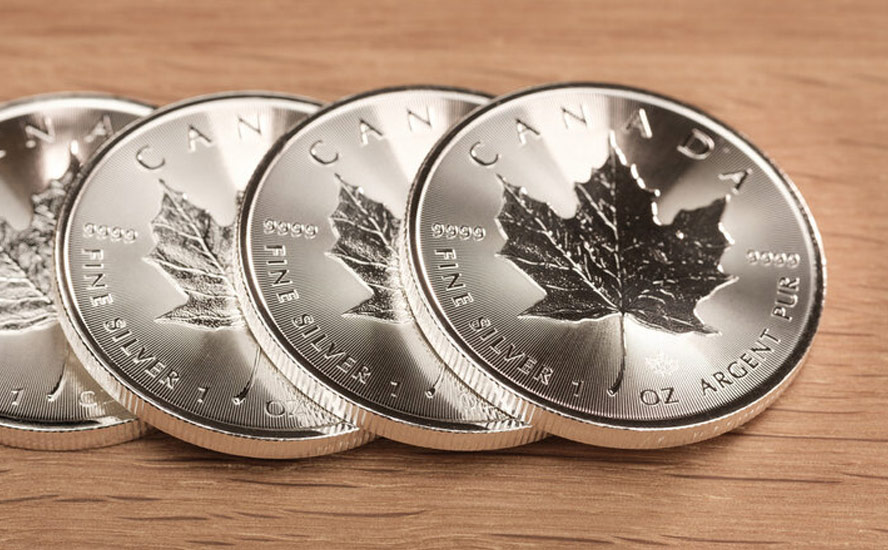
Silver has some of the same properties as gold, making it suitable for artwork, jewelry, and as a medium of exchange in silver coins and bars.
But unlike gold, silver has many more industrial applications – almost as many as oil. The precious metal is strong, malleable and conducts heat and electricity better than any other material. Gold also has these properties but it is too expensive to use in circuit boards, solar panels, electric cars, etc.
Industrial uses include solar panels, electronics and the automotive industry.
The solar power industry currently accounts for 13% of silver’s industrial demand.
More and more silver will be demanded for its use in solar photovoltaic cells, as countries move further towards adopting renewable energy sources. Around 20 grams of silver are required to build a solar panel. The Silver Institute predicts 100 gigawatts of new solar facilities will be constructed per year between 2018 and 2022, which would more than double the world’s 2017 capacity of 398GW.
According to a recent report by CRU Consulting, the amount of electricity generated by solar power is expected to increase by 1,053 terawatt hours (TWh) by 2025, which is nearly double what was produced in 2019.
All of that solar will be a major boon for silver.
CRU expects PV manufacturers to consume 888 million ounces of silver between now and 2030. That’s 51.5 million oz more than the combined output from all the world’s silver mines in 2019.
A study last year by the University of Kent found that rising demand for solar panels is driving up silver prices.
5G technology is set to become another big new driver of silver demand.
5G is the next generation of mobile broadband that will eventually either replace or augment existing 4G LTE connections. The main benefits of 5G are its drastically improved upload and download speeds. Latency, which is the time it takes devices to communicate with wireless networks, is also much quicker using 5G.
According to the Silver Institute, The electronic components that enable 5G technology will rely strongly on silver to make the global 5G platform perform seamlessly. In a future 5G connected world, silver will be a necessary component in almost all aspects of this technology, resulting in yet another end-use for silver in an already vast and versatile demand portfolio.
Among the 5G components requiring silver, are semiconductor chips, cabling, microelectromechanical systems (MEMS), and Internet of things (IoT)-enabled devices.
The Silver Institute expects silver demanded by 5G to more than double, from its current ~7.5 million ounces, to around 16Moz by 2025 and as much as 23Moz by 2030, which would represent a 206% increase from current levels.
The Trump administration is said to be preparing a nearly $1 trillion infrastructure proposal – some of the dollars are geared toward 5G/ broadband – as a way of spurring the world’s largest economy back to life.
Gold-silver ratio
Gold and silver prices are often compared, to get a sense of which direction each are headed. The gold-silver ratio is the amount of silver one can buy with an ounce of gold. Simply divide the current gold price by the price of silver, to find the ratio.
When gold is over-valued compared to silver, investors take advantage of the arbitrage opportunity, by selling some of their gold holdings to buy silver. The opposite occurs when silver is over-valued compared to gold. In that situation, precious metals investors sell silver to buy gold.
The higher the number, the more undervalued is silver.
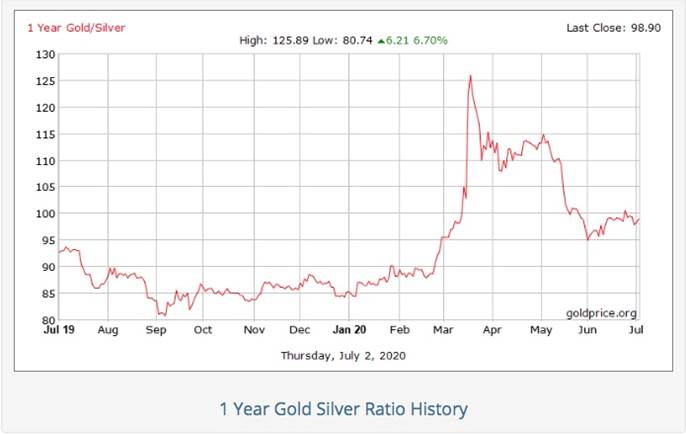
On June 12, 2019, the gold-silver ratio hit a 26-year high by breaking through the 90-ounce mark – meaning it took over 90 ounces of silver to purchase one ounce of gold. The higher the number, the more undervalued is silver or, to put it another way, the farther gold is pulling away from silver, valued in dollars per ounce.
The current gold-silver ratio, 98:1, is way higher than the historical ratio of 50-60 ounces of silver to one ounce of gold, meaning that silver is highly undervalued compared to gold. It means an investor with an ounce of gold could sell his gold for 98 ounces of silver.
Silver prices
Silver and gold both spiked last summer after the US Federal Reserve began cutting interest rates. That, along with similarly dovish policies among other central banks, a record $17-trillion of negative-yielding sovereign bonds, and fresh safe haven demand due to tensions with Iran, and a lack of progress on trade talks, powered the precious metals to new heights.
Silver prices rose 15% in 2019, helped by a 12% increase in silver investment demand – the highest annual growth since 2015.
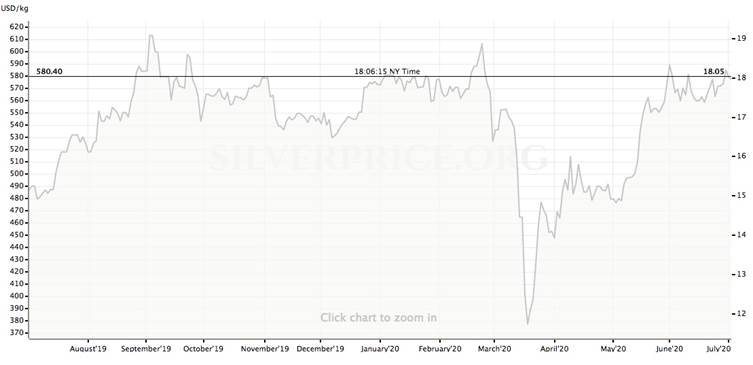

In March, 2020, silver plunged to a 10-year low as the world was panicked by the onset of the coronavirus pandemic. However, in May it jumped more than 19% on expectations of a swift economic recovery, ie., an increase in demand for its many industrial applications. From March 18 to June 1 the white metal ran 52%, erasing all of its losses during the dark days of the pandemic in March and April.
Silver prices will test $19 an ounce later this year on the back of heavy investment demand, as the coronavirus continues to depress markets and push investors in the direction of safe havens like precious metals.
That is the conclusion of The Silver Institute’s annual World Silver Survey, compiled by research firm Metals Focus and released in April.
Silver ETF holdings in June sat at 746 million ounces, the highest on record according to Bloomberg data.
Silver supply and demand
Silver prices are driven by mine supply/ recycling and demand from both retail/ institutional investors and industry.
The drop in demand for most goods and services owing to covid-19 doesn’t exempt silver – industrial fabrication is seen falling by 7%, along with jewelry and silverware offtake – but the report projects these declines will be offset by a 16% increase in silver bar and coin demand. There is also expected to be strong inflows into silver-backed ETFs as well as net buying by institutional investors on both the futures and OTC markets.
And while the white metal, sometimes called “poor man’s gold”, is expected to be in surplus again this year, the Silver Institute says the glut will be limited (to 14.7 million ounces, 53% smaller than in 2019), by a number of virus-related government shutdowns in top producers Mexico and Peru.
The Silver Institute therefore expects silver prices, currently trading around $18 an ounce, to hit $19 before year-end, possibly even outperforming gold on the back of its historically low relative value. If that happens, it would be a repeat of silver’s pattern last year.
While demand for silver, like for most industrial metals, will fall during this period of virus-related uncertainty, after the pandemic is beaten, we expect it to come roaring back, and the extremely out-of-whack gold-silver ratio to correct, in silver’s favor.
In fact we have already seeing this correction happening. While the gold-silver ratio climbed to an all-time high of 126:1 in mid-March, it tumbled to 95:1 in June, largely on the strength of investment demand, and currently sits at 98.9:1.
Silver supply is sensitive to mine production cuts – as we have seen recently with coronavirus-related stoppages. However, silver is also vulnerable to supply slippage, more so than gold, because there are relatively few pure-play silver mines.
Only around 30% of annual supply comes from primary silver mines while more than a third is produced at lead/zinc operations and a further 20% is from copper mines. Over two-thirds of the world’s silver resources are sourced from polymetallic ore deposits.
That makes silver quite a bit different from gold, in that primary gold deposits, with relatively few other minerals, are common. Large deposits of gold are also found in copper-gold porphyries.
Not so for silver, which most often has to be coaxed out of lead and zinc ores, followed by mines specializing in copper and gold, in that order.

Only 28% of global silver production is sourced from primary silver mines. Last year’s World Silver Survey delineated the world’s largest primary silver mines. Topping the list was Fresnillo’s Saucito mine in Mexico, which in 2018 produced 19.9 million ounces. Second spot went to Polymetal’s Dukat mine in Russia (16.5Moz), followed by Buenaventura Mines’ Uchucchacua mine in Peru, producing 15.4Moz.

According to the US Geological Survey, Mexico is by far the largest producer, outputting 6,300 tonnes in 2019, followed by Peru and China, at a respective 3,600t and 3,800t. Next on the list are Russia, Poland and Australia. Global silver production in 2019 totaled 27,000 tonnes, or 868 million ounces.

Where are the world’s largest silver mines, including mines that produce silver as a by-product of other metals?
The 2020 Silver Survey has KGHM Polska Miedz’s three copper-silver mines in Poland – Lubin, Rudna and Polkowice-Sieroszowice – leading by a long shot, at 40.2Moz in 2019.
That is almost twice the production of number 2 Penasquito (22.7Moz) and over double Dukat’s 19.3Moz. Saucito, ranked highest last year in primary silver mine production, in 2020 is the fourth-largest mine in the world containing silver and other metals.

Conclusion
As smart resource investors, we want to be investing in metals, and companies, that are at the leading edge of a trend.
Until we can say, in a broad sense, that re-openings have succeeded and the coronavirus is on the wane, gold and silver are going to continue to do well. In the current deflationary environment, gold is gaining because of all the drivers that make it such an attractive investment – a high global debt to GDP ratio from the combination of falling economic growth and rising national debts, owing to massive virus-related stimulus; growth of the M2 money supply lighting a fire under gold prices; continued low interest rates until at least 2022; a steady flow of safe-haven demand, due to a number of global hot spots particularly with regard to a more belligerent China; and social/ economic chaos gripping the United States as it enters a presidential election.
Gold is also expected to climb in the likely event that all of this stimulus – at last count $18.4 trillion!- leads to inflation.
If inflation goes, say, above 3%, yet interest rates remain near zero, that would create a bullish condition for gold – negative real rates (interest rates minus inflation). When US Treasury bond yields turn negative, investors typically rotate their funds out of bonds, into gold.
Silver prices typically follow gold prices. We have recently seen the gold-to-silver ratio decline, from over 125:1, to the current 98:1, meaning it takes 98 ounces of silver to buy one ounce of gold. Historically, the ratio is closer to 60:1, so silver is still quite undervalued compared to gold.
We have the same bullish indicators for silver as for gold, in terms of safe-haven demand inciting investors to park their money in silver bullion, silver ETFs or silver mining stocks, and the fact that silver is not subject to inflation like paper currencies.
Now, supposing the coronavirus retreats and economic growth begins to take off. About 60% of silver demand comes from industrial uses like solar power and electronics. 5G is set to become another major new driver of silver demand. In my opinion, strong demand for these uses, combined with steady inflows to silver-backed ETFs for investment purposes due to a slow recovery from the coronavirus particularly in the United States, are bound to drive silver prices higher over the next few months. Now is therefore a great time to be investing in silver and undervalued silver juniors which offer excellent leverage against rising prices.
Richard (Rick) Mills
aheadoftheherd.com
subscribe to my free newsletter
Ahead of the Herd Facebook
Legal Notice / Disclaimer
Ahead of the Herd newsletter, aheadoftheherd.com, hereafter known as AOTH.
Please read the entire Disclaimer carefully before you use this website or read the newsletter. If you do not agree to all the AOTH/Richard Mills Disclaimer, do not access/read this website/newsletter/article, or any of its pages. By reading/using this AOTH/Richard Mills website/newsletter/article, and whether or not you actually read this Disclaimer, you are deemed to have accepted it.
Any AOTH/Richard Mills document is not, and should not be, construed as an offer to sell or the solicitation of an offer to purchase or subscribe for any investment.
AOTH/Richard Mills has based this document on information obtained from sources he believes to be reliable but which has not been independently verified. AOTH/Richard Mills makes no guarantee, representation or warranty and accepts no responsibility or liability as to its accuracy or completeness. Expressions of opinion are those of AOTH/Richard Mills only and are subject to change without notice. AOTH/Richard Mills assumes no warranty, liability or guarantee for the current relevance, correctness or completeness of any information provided within this Report and will not be held liable for the consequence of reliance upon any opinion or statement contained herein or any omission. Furthermore, AOTH/Richard Mills assumes no liability for any direct or indirect loss or damage or, in particular, for lost profit, which you may incur as a result of the use and existence of the information provided within this AOTH/Richard Mills Report.
AOTH/Richard Mills is not a registered broker/financial advisor and does not hold any licenses. These are solely personal thoughts and opinions about finance and/or investments – no information posted on this site is to be considered investment advice or a recommendation to do anything involving finance or money aside from performing your own due diligence and consulting with your personal registered broker/financial advisor. You agree that by reading AOTH/Richard Mills articles, you are acting at your OWN RISK. In no event should AOTH/Richard Mills liable for any direct or indirect trading losses caused by any information contained in AOTH/Richard Mills articles. Information in AOTH/Richard Mills articles is not an offer to sell or a solicitation of an offer to buy any security. AOTH/Richard Mills is not suggesting the transacting of any financial instruments but does suggest consulting your own registered broker/financial advisor with regards to any such transactions
Legal Notice / Disclaimer
Ahead of the Herd newsletter, aheadoftheherd.com, hereafter known as AOTH.Please read the entire Disclaimer carefully before you use this website or read the newsletter. If you do not agree to all the AOTH/Richard Mills Disclaimer, do not access/read this website/newsletter/article, or any of its pages. By reading/using this AOTH/Richard Mills website/newsletter/article, and whether you actually read this Disclaimer, you are deemed to have accepted it.
