Leading Indicators Point to Higher Gold

2019.10.12
Anticipation of a trade deal between the United States and China had investors and traders in a risk-on mood as the week drew to a close.

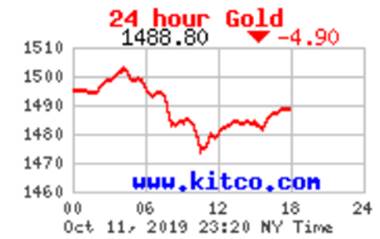
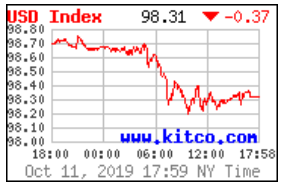
On Friday, October 12, both the US dollar and gold were down sharply, continuing a trend that started on Thursday after President Trump said he would meet with China’s top trade negotiator, Vice Premier Lui He, at the Oval Office on Friday.
 |
 |
Around 10:30 am PST, prior to the Trump-Lui He meeting, Bloomberg tweeted that a partial trade had been reached. The agreement reportedly has China making agricultural concessions and the US promising some tariff relief. It could “lay the groundwork for a broader deal that Presidents Donald Trump and Xi Jinping could sign later this year,” the news service said.
At time of writing spot gold had dropped to $1488.80/oz, about $10 less than Thursday’s New York close. Meanwhile the buck continued to slide, with the US dollar index (DXY) showing 98.31 against a basket of currencies, a fall of 0.84 compared to Wednesday’s 99.15. A potential trade deal weighs on the dollar because it implies the USD and the Chinese yuan could be devalued.
The Dow on the other hand rallied 400 points Friday morning on reports of better-than-expected progress at the first day of renewed trade negotiations at the Office of the US Trade Representative. The stock bounce was also supported by a University of Michigan survey that indicated optimism among American consumers was at the highest in three months, CNN reported.
While a trade deal or partial agreement was on the minds of precious metals investors as they headed into the Canadian Thanksgiving long weekend, there are other factors to keep in mind with respect to future gold and silver prices.
An AOTH analysis shows that despite recent price pullbacks, there is plenty of fight left in the precious metals bull.
Rush to ETFs
Our first sign of a better-than-average appetite for gold is the record-breaking interest in gold-backed exchange-traded funds (ETFs).
According to the World Gold Council (WGC), in September gold ETF funds grabbed an extra 75 tonnes, with most coming from North America, bringing the total to 2,808 tonnes worldwide – the highest level of all time. ETF holdings expanded for 17 days in a row, as of October 9, which is the longest run of inflows since the financial crisis.
COMEX net longs – bets that bullion will climb higher – reached an all-time high of 1,134 tonnes in September.
Central bank gold buying isn’t letting up either. China, which has the seventh-highest amount of gold, 1,942 tonnes according to the latest WGC rankings, apparently added another 190,000 ounces, bringing its bullion haul to 62.64 Moz. That’s the 10th straight month Beijing has increased its gold reserves.
An aggregate 651 tonnes was amassed by central banks last year, 74% more than 2017 and the highest amount since the end of the gold standard in 1971.
The 2018-19 gold-buying spree is being driven by the de-dollarization of countries like Russia, China and Turkey which have an axe to grind with the US. They want to get out from under the thumb of Uncle Sam.
Why are they buying?
The positive sentiment for gold shouldn’t surprise anyone who has been following the negative financial news of late. Hitherto, the trade war has hit America’s trading partners, like the EU, worse than itself, but that is starting to change. As Citigroup puts it, “Markedly weak manufacturing and services ISM data [recent indicators of US economic data] show that the slowdown in global trade is starting to bite the U.S. economy.”
An ISM survey measuring the health of the US factory sector, contracted for the second straight month.
On October 8th World Bank President David Malpass said that global growth is deteriorating amid Brexit uncertainty, the trade war and the downturn in Europe including Germany, the engine of the EU’s economy. He said the world economy is weaker than the World Bank’s June forecast of 2.6% growth in 2019.
WGC points to a number of other catalysts for gold in October. These include: global uncertainty due to an impeachment investigation hanging over the White House; the Brexit deadline looming at the end of October; and better-than-normal US stock market performance in October, normally a weak month for equities.
Of course the immediate levers pulling on gold are interest rates and bond yields. Gold generally climbs, becoming more valuable to investors looking for income from their investments, when interest rates and bond yields fall.
This past week the European Central Bank pushed its bond rate further negative to -0.5%, and its vice president hinted at further cuts, saying “the side effects of monetary policy are becoming more and more evident.” The ECB in September resumed a 2.6 trillion euro bond-buying program.
Japan’s short-term interest rates are at -0.1% and its central bank also said it is mulling a further rate cut. It too is continuing a massive asset-buying program as it aims to stimulate a flagging economy.
On Sept. 18 the US Federal Reserve cut interest rates another quarter point, to 2%.
Follow real rates, not the dollar
As for bond yields, gold is currently trading around $1,480 as US real Treasury yields (T-bill yield minus inflation) skid along at practically zero (the 10-year is currently yielding a net -0.03% and the 3-year is -0.21%). That would normally be terrible for US Treasuries but they are in fact attractive among much of the world’s sovereign debt, which is offering far more negative yields.
Currently a quarter of all sovereign debt, worth a shocking $17 trillion, is paying bond holders less than 0%. Investors are so desperate for safe havens they are plunking savings into Greek bonds! On Wednesday it was reported that Greece has joined the ever-widening club of negative-yielding European nations. The country that very nearly was kicked out of the EU and required a bail-out, sold 487.5 million euros of 13-week (short-term) bills, offering its first-ever negative yield of -.02%. In 2017 the same bills fetched +2.7%. Many are noticing the irony of investors grabbing onto debt instruments issued by highly risky Greece, whose profligate spending put the country in such a debt quandary in the first place, forcing it to accept a 281.9-billion-euro loan that will take decades to repay.
To sum up, we have a whole cluster of factors that are shoring up gold prices, despite a possible trade deal between the US and China hanging in the balance. Even with the partial trade agreement announced on Friday, gold only dropped $5 from Thursday, in fact it gained $5 from its $10 drop earlier in the day.
The big question mark though, the elephant in the room concerning precious metals prices right now, is the US dollar. Notwithstanding this week’s drop for both gold and the dollar, why has the gold price been gaining along with the dollar? Normally the two move in opposite directions. Why hasn’t a surging buck upended the current bull market for gold?
The answer really has to do with economic growth and interest rate differentials, the two main drivers of the dollar.
Bond yields have been falling, in the US and its two main competitors for sovereign debt – the EU and Japan. But the ECB and Bank of Japan both have yields more negative than US Treasuries, in fact owning a US 10-year note compared to a 10-year in Germany or Japan would earn investors a respective 175 and 200 basis points. The 10-year German bund currently carries a rate of -0.59%.
As mentioned Japan and the EU have both re-started large-scale bond-buying programs otherwise known as quantitative easing. The US hasn’t yet taken that drastic step.
And while growth in the US has been slowing, from 3.1% in the first quarter, to 1.8% in the second and third quarters, the economy so far this year has performed better than the 1.4% the EU managed in the second quarter and Japan’s sickly 1%.
Michael Pento of Pento Strategies writes an interesting piece arguing that those looking at the dollar for a signal on gold prices are barking up the wrong tree; real rates are the better predictor of gold prices:
[T]he primary driver of gold isn’t the direction of the dollar but the direction of real interest rates. Hence, if US growth is accelerating in a non-inflationary environment, gold should suffer regardless of the direction of the US dollar. Conversely, the USD dollar can be in a bull market against a basket of fiat currencies—as it has been for the past year—and yet can still lose significant ground against gold as long as nominal interest rates are falling in an environment of rising inflation.
Thus, with core inflation – the inflation rate after removing high-volatility items like food and energy – increasing to 2.4% in August, subtracted from the interest on the US 10-year note which has plummeted from 3% yield to 1.6% over the past year, “real yields have been crashing as gold has been rising,” Pento writes. He adds:
These falling real yields were rocket fuel for gold, and this was in spite of the USD’s bull market against the euro and yen. The price of gold increased by double digits even though the Dollar Index has also increased by nearly 5% in the last 12 months.
Lying with statistics
Okay, you say, I now see how it’s possible for gold to rise at the same time as the US dollar. And I get that the US economy is growing faster than Europe and Japan’s. Surely, though, there is more to the ups and downs of the dollar.
Indeed there is. The dollar is a reflection of the US economy, so now we have to look at economic indicators. The trouble is, there are so many indicators, that accounting for all of them would be impossible. Is the economy weak or strong? It really depends on where you look.
By two often-cited variables, unemployment and consumer spending, the US economic engine appears to be chugging along just fine. The latest job numbers show that only 3.5% of Americans actively looking for jobs are job-less. The United States haven’t seen that few unemployed in 50 years. Consumer confidence in October rose to 96 from 93.2 in September, quite a bit better than the 86.59 average since 1952.
However diving a little deeper into the recesses of the economy, we find some troubling numbers that don’t get exposed in most media reports. Take manufacturing and employment as two examples.
The IHT Markit US Manufacturing PMI fell to its lowest in 10 years in July, 49.9. While September saw an uptick to 51.1 due to a rise in production, the sector still looks pretty shaky. US factory output also contracted for the first time in a decade, in July, to 50.4. August saw the sharpest downturn in order books in 10 years, and the fastest reduction in export sales since 2009.
The ISM Manufacturing Index – which measures monthly production level based on a survey of purchasing managers at more than 300 manufacturing firms – in September fell to 47.8% from 49.1% in August. It was the second straight month the index was below 50%, and is the lowest reading since 2009.

“The key takeaway from the report is that the contraction is a by-product of weakening business confidence that is stemming in part from the trade uncertainty,” states Briefing.com.
The ISM Non-Manufacturing PMI wasn’t quite as bad; it fell to 52.6, off 0.2% from August, and the lowest reading since August 2016, “with firms mostly concerned about tariffs, labor resources and the direction of the economy,” reports Trading Economics.
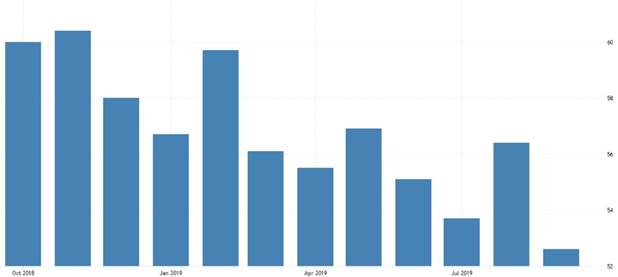
Notice the common thread here is the trade war.
The 3.5% unemployment rate is hard to argue with, but while employment conditions look to be holding steady, a deeper look shows less reason to be confident.
The US economy needs 150,000 jobs a month just to keep up with population growth. So far in 2019, average monthly job creation is 161,000 vs. 218,000 in 2018. It’s actually not a great year to be unemployed in the United States.
Take payroll employment and household employment. The former is the figure usually given but it does not include the agricultural sector ie. farmers hard-hit by Chinese import tariffs – nor the self-employed. Third-quarter payrolls of production and non-supervisory workers gained 70,000, but that is well below the average monthly payroll gain of 98,000 during the second quarter. It’s the smallest quarterly gain since 2010.
Payrolls of production and non-supervisory workers in mining, manufacturing, retail trade, utilities, leisure and hospitality declined in Q3.
How about part-time workers? Their numbers have stayed about the same. Still, that’s 4.4 million people, more than the population of Canada’s largest city, Toronto, “who would have preferred full-time employment, were working part time because their hours had been reduced or they were unable to find full-time jobs,” Trading Economics states.
Average hourly earnings were also flat in September, up 2.9% versus 3.2% in September 2018. That means wages are not growing much more than the 2.4% core rate of inflation. Increases in worker pay over the past 12 months declined from 3.2% to 2.9%. The participation rate was largely unchanged at 63.%.
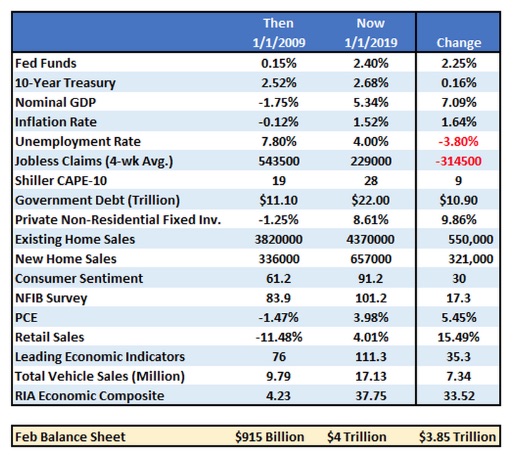
More rate cuts, QE likely
The employment numbers are a good example of the glass half-full or half-empty analogy. The number that everyone grabbed hold of last Friday, was the 3.5% lowest unemployment rate since 1953. Reading the jobs report a little closer though shows the economy added 136,000 jobs, less than the 150,000 expected.
“This is the slowest pace of job growth in four months, as businesses grew more cautious about hiring…” according to Marketwatch.
The markets are so addicted to cheap interest rates that this was actually seen as a positive, in that negative economic news strengthens the possibility of another interest rate reduction.
In fact there is now a 79% chance of another quarter-point rate cut when the Federal Reserve meets again to set rates on October 28-29.
How about more quantitative easing? Although the Fed has been trying since 2017 to “unwind” the three rounds of QE by selling Treasuries and other assets, known as “quantitative tightening”, the Federal Reserve’s balance sheet has actually expanded by $185 billion according to technical analyst David Chapman’s column in Goldseek. During each of the last three QEs, the balance sheet only increased by about $47 billion per month. Chapman says his suspicion of a coming Q4 “has centered on possible cash crunches and liquidity problems in the eurozone that could spread into the U.S. banking system.”
There’s also something funny going on in the repo market. Repo is short for re-purchase agreements, which are collaterized overnight loans made to big investors like mutual funds.
The repo market facilitates the flow of cash and securities, including the over $16 trillion US Treasury market. However during the week of September 16, too much cash went out than securities came in, meaning there suddenly wasn’t enough cash for those who needed it. Even more alarming for the Fed, which controls the money supply, the volatility in the repo market pushed the federal funds rate – the benchmark interest rate – above its acceptable range of 2.25%, just as the Fed was preparing to drop the ceiling to 2% on Sept. 18.
That forced the Fed to lend up to $75 billion a day in temporary cash, for four days, to quell the funding crunch and to push the funds rate down.
To avert such a crisis from happening again, it’s been recommended that the Fed increase its reserves by $250 billion over the next two quarters, and possibly, to keep expanding the Fed’s balance sheet to suit the repo market. The only way to do that will be to purchase assets, in other words, quantitative easing round 4.
Monetary easing in the form of further interest rate cuts and large-scale purchases of US Treasuries and other assets by the Fed, always bode well for gold prices.
Fresh safe haven demand
Depending on happens over the next few days, one of the most confusing files of the Trump administration – the trade war with China – could finally be on track to a resolution. Or not. With Trump at the wheel, you just never know.
Notwithstanding the result of trade talks, however, there is so much turmoil going on in Washington and on multiple foreign policy fronts, that safe-haven gold is bound to benefit.
And even if the US and China do come to an arrangement, how about all the bad blood that has flowed between officials of the world number one and two economies? Will all be suddenly forgiven, will Xi and Trump be having ‘perfect’ phone calls, be sending each other love letters? It’s unlikely. The White House is reportedly weighing policies that would restrict American capital going to the Chinese market, including the ability of US pension funds to invest in Chinese stocks. As Tyler Durden at Zero Hedge argues,
In reality, the plan is just another way to impose ‘soft’ capital controls to ratchet up the pressure on Beijing at a time when a weakening economy and currency have stirred up a wave of capital outflows, adding stress to the already heavily indebted Chinese financial system.
Washington has also reportedly been looking into restricting Chinese companies from listing on US exchanges, and other restrictions on investments in Chinese markets. These efforts are advancing even after American officials pushed back strongly against reports late last month claiming these measures were under review.
Then there’s the fact that the US blacklisted 28 Chinese tech companies due to them purportedly repressing Muslims in Xinjiang, an autonomous territory in northwestern China. CNBC reports the Chinese trade delegation tempered expectations of a deal when the blacklist came out. Who knows, it could still thwart an agreement.
Consider too, how Beijing swung a full-court press onto the NBA, telling the national basketball association it won’t broadcast or stream any pre-season games. The flagrant foul came after the general manager of the Houston Rockets expressed support for pro-democracy demonstrators in Hong Kong, which reverted to Chinese rule from Britain in 1997.
Finally, there’s the jumble of hot spots around the world that, never far from the markets, could flare up anytime. They include the trade war, Brexit, US-Iran tensions, Hong Kong civil unrest, and the latest Trump administration imbroglio over pulling troops out of northern Syria and giving Turkey a green light to attack the Kurds. Turkey immediately mounted an attack against Kurdish forces, prompting bipartisan accusations that Trump betrayed the Kurds, a US ally. Senator Lindsey Graham, normally a vocal Trump supporter, called the pullout the biggest mistake of Trump’s presidency. And now ISIS, who President Trump said was defeated, is back in the news.
And Turkey, because of sanctions from Germany and coming sanctions from the UK, and the US, might be driven out of NATO into Russia’s arms. Trump is going to have a lot of blood on his hands from this, a second Republican double cross of the Kurds. It also seems to your author that any time Trump meddles in international affairs regarding America’s allies Russia come out ahead.

And let’s not forget the Democrats’ attempts to impeach Trump, amid multiple whistle blowers who have come forward to tell of the President’s attempts to pressure the Ukraine into investigating Democratic presidential candidate Joe Biden – upon which the impeachment inquiry is based.
Conclusion
Gold investors love nothing more than a war, economic crisis or any type of geopolitical instability to watch the value of their bullion grow. Heightened global tensions such as terrorist attacks, border skirmishes or civil unrest scare investors into putting their funds into safe havens like gold and stable sovereign debt like US Treasuries. Take your pick from the aforementioned scenarios.
The real kicker for gold though is negative real interest rates which, notwithstanding a major global economic reset that gets growth moving again, are likely to be with us for a long time.
At AOTH, it’s our opinion that US interest rates and those at other G20 countries will keep falling. They need to keep rates low to boost lending and hike insipid economic growth. Trump’s obsession with having a low dollar to increase exports and repair the mountainous trade deficit fits with this narrative.
Also consider that rising levels of US debt are a major deterrent in raising interest rates; the Fed has lowered rates by a total of 0.5% at its last two meetings – a low-rate environment is likely to continue for the foreseeable future, considering the economic uncertainty both globally and domestically. US manufacturing weakness and worse-than-reported unemployment are just two examples of the latter.

I believe this is one of the best times in history to own precious metals and quality junior gold explorers upon which to leverage higher gold prices.
Richard (Rick) Mills
subscribe to my free newsletter
Ahead of the Herd Twitter
Legal Notice / Disclaimer
Ahead of the Herd newsletter, aheadoftheherd.com, hereafter known as AOTH.
Please read the entire Disclaimer carefully before you use this website or read the newsletter. If you do not agree to all the AOTH/Richard Mills Disclaimer, do not access/read this website/newsletter/article, or any of its pages. By reading/using this AOTH/Richard Mills website/newsletter/article, and whether or not you actually read this Disclaimer, you are deemed to have accepted it.
Any AOTH/Richard Mills document is not, and should not be, construed as an offer to sell or the solicitation of an offer to purchase or subscribe for any investment.
AOTH/Richard Mills has based this document on information obtained from sources he believes to be reliable but which has not been independently verified. AOTH/Richard Mills makes no guarantee, representation or warranty and accepts no responsibility or liability as to its accuracy or completeness. Expressions of opinion are those of AOTH/Richard Mills only and are subject to change without notice. AOTH/Richard Mills assumes no warranty, liability or guarantee for the current relevance, correctness or completeness of any information provided within this Report and will not be held liable for the consequence of reliance upon any opinion or statement contained herein or any omission. Furthermore, AOTH/Richard Mills assumes no liability for any direct or indirect loss or damage or, in particular, for lost profit, which you may incur as a result of the use and existence of the information provided within this AOTH/Richard Mills Report.
AOTH/Richard Mills is not a registered broker/financial advisor and does not hold any licenses. These are solely personal thoughts and opinions about finance and/or investments – no information posted on this site is to be considered investment advice or a recommendation to do anything involving finance or money aside from performing your own due diligence and consulting with your personal registered broker/financial advisor. You agree that by reading AOTH/Richard Mills articles, you are acting at your OWN RISK. In no event should AOTH/Richard Mills liable for any direct or indirect trading losses caused by any information contained in AOTH/Richard Mills articles. Information in AOTH/Richard Mills articles is not an offer to sell or a solicitation of an offer to buy any security. AOTH/Richard Mills is not suggesting the transacting of any financial instruments but does suggest consulting your own registered broker/financial advisor with regards to any such transactions
Legal Notice / Disclaimer
Ahead of the Herd newsletter, aheadoftheherd.com, hereafter known as AOTH.Please read the entire Disclaimer carefully before you use this website or read the newsletter. If you do not agree to all the AOTH/Richard Mills Disclaimer, do not access/read this website/newsletter/article, or any of its pages. By reading/using this AOTH/Richard Mills website/newsletter/article, and whether you actually read this Disclaimer, you are deemed to have accepted it.
