It’s not over for commodities and PMs – Richard Mills

2026.01.29
Some are thinking copper, gold and silver are getting toppy and that has them calling for a pullback in prices.
I believe the elements underpinning the commodities bull market are intact and unlikely to fall apart in 2026. Here I’ll analyze these factors to support my thesis that the bull market not only for precious metals but commodities in general is set to continue in the months ahead.
Gold and silver continue to rally this week on geopolitical tensions, tariffs, a soft dollar, and a fresh headwind: a potential shutdown of the US government as early as this weekend. Safe-haven demand for precious metals was stimulated when it became clear that senators were scrambling to avoid a partial government shutdown following the second fatal shooting by ICE agents in Minneapolis on Saturday.
Apparently there is no deal in sight for a Department of Homeland Security appropriations measure that is part of a multi-bill funding package sent to the Senate last Thursday before it went on recess.
Democrats want changes to the DHS measure including requiring judicial warrants for immigration arrests, de-masking federal agents, and requiring DHS to cooperate with state and local investigations.
Republicans are reluctant to engage and want the package to be voted on without amendments.
Senators must clear it before 12:01 a.m. Saturday, Jan. 31 — or spark funding lapses across multiple agencies.
There is now an 80% probability that a shutdown will occur by the end of the week.
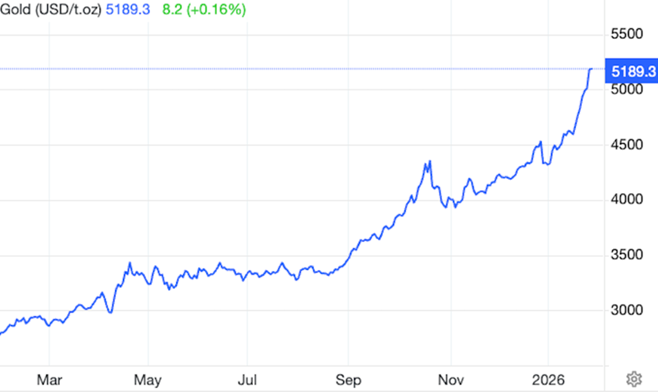
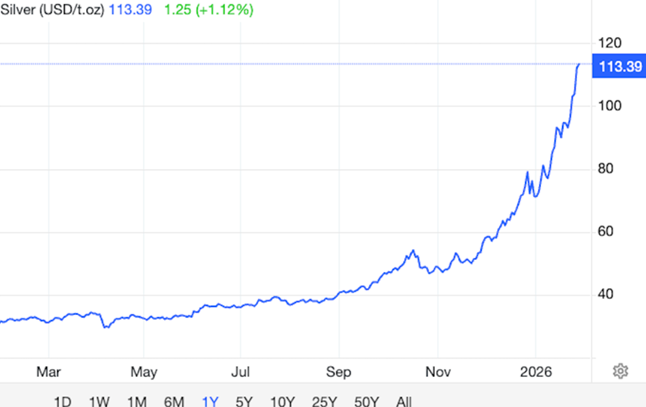
In early morning trading Monday, gold held firmly above $5,000 an ounce, gaining 1.7%, while silver rose 6%, hitting above $100/oz.
As of this writing, Tuesday, gold was at $5,189 and silver was trading at $113.39.
Gold
Technical analysis shows gold is entering a new secular bull market that could push prices much higher.
After a multi-decade consolidation, gold has broken out, forming a classic cup and handle pattern ahead of the move. At the same time, the gold-to-S&P ratio — how many ounces it takes to buy the index — also broke out of a decade-long downtrend.
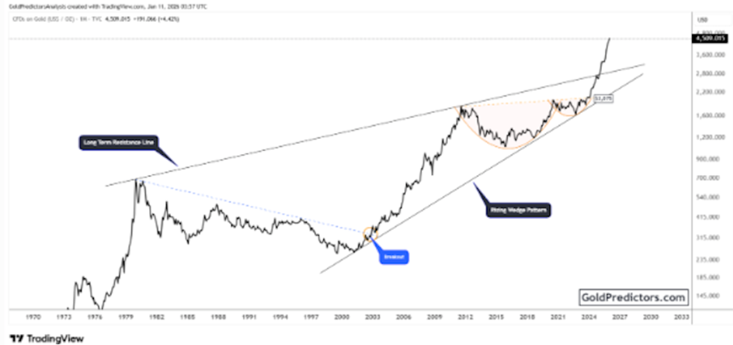
The breakout started in the early 2000s with a broadening wedge structure. This consolidation phase — during which there was a lot of gold M&A — formed a cup and handle pattern, with gold moving above the $2,000 resistance level, confirming the end of the handle formation and launching a new bullish phase within the broader wedge.
Following this breakout, gold pushed sharply higher, reaching above $4,500 by early 2026.
The gold-to-S&P 500 ratio highlights gold’s outperformance relative to equities. After peaking in the early 1980s, the ratio entered a long-term decline, with gold underperforming equities for nearly three decades. This downtrend ended in 2002, when the ratio began climbing steadily, signaling a shift from equities into hard assets.
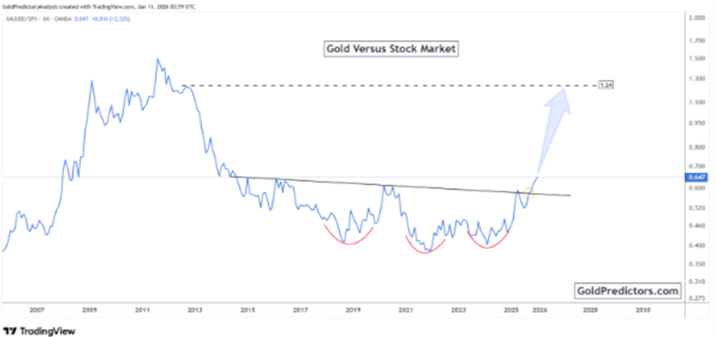
In late 2024, the ratio moved above another key descending trendline, pointing to a renewed rotation away from equities and back into gold.
Gold’s recent swift climb above $4,400 confirms the breakout’s strength and supports the case for higher longer-term targets, with the next resistance levels likely in the $6,000 to $8,000 range.
Gold’s surge to +$5,000 an ounce — an 85% gain over the past year — is naturally benefiting producers, since higher prices increase revenues and pad margins. Take the three largest gold miners.
Newmont (NYSE:NEM) is up 9.1% over the past five days, Barrick (NYSE:B) gained 7% over the same period, and Agnico Eagle Mines (NYSE:AEM) jumped 7.4%. On Monday, NEM climbed to $62.80, just a few cents short of its record closing high of $62.93 in May 2008.
Agnico Eagle President and CEO Ammar Al-Joundi told ‘Mad Money’ host Jim Cramer that there have been three catalysts for gold over the past four years: profligate government spending/ debt, which we’ll get into separately in a section below; Russia invading Ukraine and getting kicked out of the SWIFT system of settling international transactions; and an increasingly disordered world.
The Trump administration has sent US forces to capture Venezuelan President Nicolas Maduro, threatened other Latin American countries like Cuba and Colombia, vowed to restore US dominance in the Western hemisphere, talked about annexing Greenland, and imperiled transatlantic security cooperation.
The chaos in the Gaza strip continues, as does the nasty war in Ukraine which has now been raging for four years.
Cramer pointed out that China has been selling Treasuries and snapping up gold to feed a seemingly insatiable demand for it. Al-Joundi agreed, adding that it’s not only China; other countries are getting nervous about their Treasury holdings.
Silver
Silver had a phenomenal 2025, more than doubling from around $30/oz to above $70 by late December, and the rally has continued into the new year. The question on many people’s minds is will it continue? And will silver’s performance again outpace gold’s this year?
The first thing to consider when asking this question is that the silver market is different from the gold market, not only in that it’s smaller and more volatile, but it has a heavy industrial component that is almost entirely absent from gold.
Industrial consumption now accounts for more than half of total silver consumption, with a plethora of uses including in solar panels, electric vehicles, and most recently, in data centers and other artificial intelligence-related applications.
Under the Spotlight – Silver in ‘26
Demand for silver, along with gold and copper, is no longer met by supply from mines without recycling it to bridge the difference. The silver market has run a deficit for the last five consecutive years, and it’s unlikely to be resolved in 2026.
Another important point is that mine production faces structural constraints in that there are few pure silver mines. Most silver is mined as a byproduct of lead-zinc, copper and gold. Hence, without major expansions of these mines, new supply is limited even as demand for the precious metal keeps climbing.
Export restrictions from the world’s second-largest silver producer, China, have created price differentials between regions, with buyers in some countries paying premiums over Western spot prices.
China is weaponizing critical minerals, including, silver, as part of a broader trade conflict with the US, aiming to limit Western access to essential manufacturing components.
Federal monetary policy of course will also have a role to play in future silver prices. For months investors have carried on under the assumption that there will be rate cuts in 2026 — a bullish signal for PMs because lower rates reduce the opportunity cost of holding non-yielding assets like gold and silver.
In Fact the Fed held rates steady Wednesday, within a range of 3.25 to 3.75%; gold and silver barely budged.
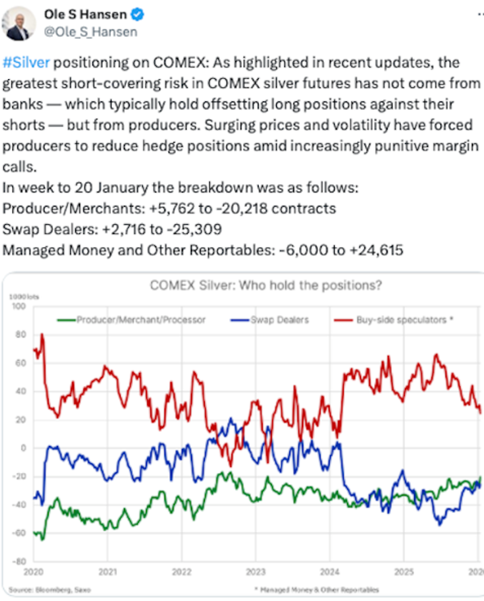
Ole Hansen, a precious metals analyst from Saxo Bank, wrote on X that China is weaponizing critical minerals, including, in this instance, silver, as part of a broader trade conflict with the US, aiming to limit Western access to essential manufacturing components.
An interesting blip in the silver rally is that those investors who bought silver-backed ETFs have not done well, earning returns considerably lower than the performance of the metal. In other words, investors were paying more than the value of the silver held by the fund.
Gold-silver ratio
Is the gold-silver ratio signaling an end to the PM breakout?
To find the ratio, simply divide the gold price by the silver price.
The collapse of the ratio from over 100:1 in early 2025 to around 57:1 in January 2026 suggests the bull market is entering a more mature phase where silver begins, again, to outperform gold.
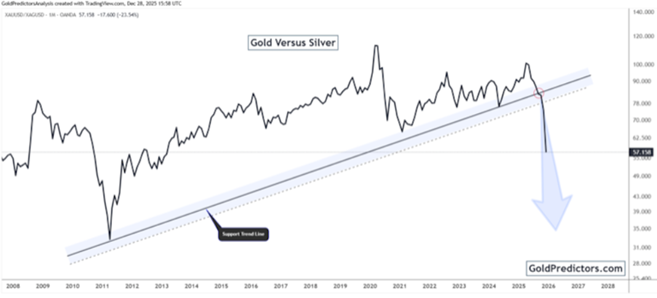
Historically, a rapidly compressing gold-silver ratio like we have observed from 2025-26 is a strong indicator of a broadening bull market, not its end.
The breakdown of the current ratio is signaling a few things. First, think of silver’s outperformance as the catchup phase. At levels above 100 in 2025 silver was highly undervalued compared to gold. By early 2026 it had fallen to around 57:1 as silver outperformed gold. The is typical in mature bull markets where silver acts as the high-beta cousin to gold.
In 2025, gold gained roughly 67% and silver’s gain was double that, 147%. Similar ratios in 2008 preceded a massive silver rally that peaked in 2011.
The parabolic move in gold and silver in 2025-26 has prompted some analysts to warn of a potential near-term correction. Others expect the ratio to continue moving to 50:1 or lower, if silver supply constraints viz a viz industrial demand persist.
In summary, the ratio suggests the “easy money” phase of gold-only appreciation may be transitioning into a “silver-led” rally, indicating a continued, rather than finished, precious metals bull market.
Debt and currency debasement
Investors pivoting to silver and gold is at least partially a reaction to the breakdown of the monetary order and the debt crisis facing governments around the world.
The US national debt currently stands at $38 trillion, leading billionaire investor Ray Dalio to ask, now that we are dealing with a breakdown in the monetary order: “Do you print money or let a debt crisis happen?”
In another interview he said, “My grandchildren and great-grandchildren not yet born, are going to be paying off this debt in devalued dollars.”
While gold’s rise has over the past couple of years has mostly been attributed to steady and strong central bank buying, especially among developing economies like the BRICS, its current rally coincides with growing pressure on government bonds in high-debt countries.
Investors are piling into hard assets and rotating out of fiat currencies and government bonds, with markets increasingly fearful that relentless government borrowing will erode the value of money.
This debasement trade, states an AI Overview, happens when governments inflate away debt by deliberately fostering high inflation, which reduces the real value of fixed-interest debt, allowing them to repay loans with cheaper, lower-purchasing-power currency. This is achieved by increasing the money supply, lowering interest rates, and using quantitative easing (monetizing debt).
BRICS launch gold-backed currency
While gold prices tend to fall when interest rates rise, it’s interesting to note that this link has been somewhat broken. Interest rates as measured by the Federal Funds Rate went from 0.25% in February 2022 to 5.5% at the end of January 2024. During this period spot gold was essentially flat, with the price starting to gain momentum in February 2024, even though interest rates were 5.5% until August 2024.
A further weakening US dollar could accelerate gold prices, since non-dollar buyers can buy more gold, priced in USD.
As an example of how governments are devaluing their currencies through massive spending, we need look only to the United States. Trump’s One Big Beautiful Bill Act over a decade is estimated to add roughly $3 trillion to the national debt. The President has also proposed boosting military spending by $1.5 trillion by 2027, prompting the Committee for a Responsible Federal Budget to warn that the plan could add nearly $6 trillion to the national debt over the next 10 years — a concern that has coincided with rising Treasury yields.
Video – Debt causes the coming economic crisis
While there has been lots of discussion recently about de-dollarization, The Mises Institute makes some good points in clarifying that it’s not about a movement from the dollar to some other fiat currency, but rather, the buck is losing its place as a global reserve to gold.
IMF figures show that the US dollar’s share of foreign exchange reserves remains at 59.6% and has been relatively stable; the euro, at 20%, is not even close to being a contender. The euro, sterling, yen and yuan have not captured lost US dollar share; in fact, their combined importance in reserves is flat or declining, while the rising share belongs to gold and other assets, including silver, oil or domestic equities in the case of Japan, states the institute.
Moreover, when it comes to FX transactions, the dollar is the undisputed champion. It is used in almost 90% of all FX transactions and roughly half of global SWIFT payments. The euro is a distant second and the yuan doesn’t even register in double digits. Mises Institute states:
“The real story is that all major fiat currencies are losing relative trust to an asset outside the system, like gold.
“Institutions all over the world have suffered losses with sovereign debt since 2021 and see no end to the inflationary currency debasement policy, while solvency is under question as governments reject any form of spending control.”
Commodities
A “commodities super-cycle” is a period of consistent price increases lasting more than five years, and in some cases, decades. The Bank of Canada defines it as an “extended period during which commodity prices are well above or below their long-run trend.”
Super-cycles occur because of the long lag between commodity price signals and changes in supply. While each commodity is different, the following is a rundown of a typical boom-bust cycle:
As economies grow, so does the demand for commodities, and eventually the demand outstrips supply. That leads to rising commodity prices, but the commodity producers don’t initially respond to the higher prices because they’re unsure whether they will last. As a result, the gap between demand and supply continues to widen, keeping upward pressure on prices.
Eventually, prices get so attractive that producers respond by making additional investments to boost supply, narrowing the supply and demand gap. High prices continue to encourage investment until finally, supply overtakes demand, pushing prices down. But even as prices fall, supply continues to rise as investments made during the boom years bear fruit. Shortages turn to gluts and commodities enter the bearish part of the cycle.
While much has been written on the dawn of a new commodities super-cycle, including The Globe and Mail and this post by Kitco News in 2024, heavily referencing my writing at the time, there is evidence to prove that the super-cycle has already begun.
Commodities: the last safe haven standing
Last week the Bloomberg Commodity Return Index climbed more than 4%, marking its strongest three-week run in almost four years. Gold, silver and platinum form the core of the hard-asset demand narrative.
Investors are seeking protection from fiscal uncertainty, currency weakness and geopolitical noise.
Precious metals and critical minerals feeling market love
We also can’t forget the effects of the sanctions Western nations placed on Russia following its invasion of Ukraine. The freezing of 300 billion euros of Russian Central Bank funds in participating countries cast a shadow of fear over other non-Western countries who began to see owning US dollar assets as dangerous. Many backed up the truck to buy gold and sold Treasuries. For the first time in many years, gold in central banks now exceeds the value of US debt.
The combination of persistent inflation, eroding trust in public institutions, and the pivot away from US dollar assets are powerful tailwinds for gold and silver.
There has also been a weather-driven repricing of energy markets, with diesel demand surging and natural gas spiking. This past weekend saw two-thirds of the United States and central and eastern Canada walloped by a blast of bitterly cold Arctic air, snow and ice caused by a breakdown of the polar vortex.
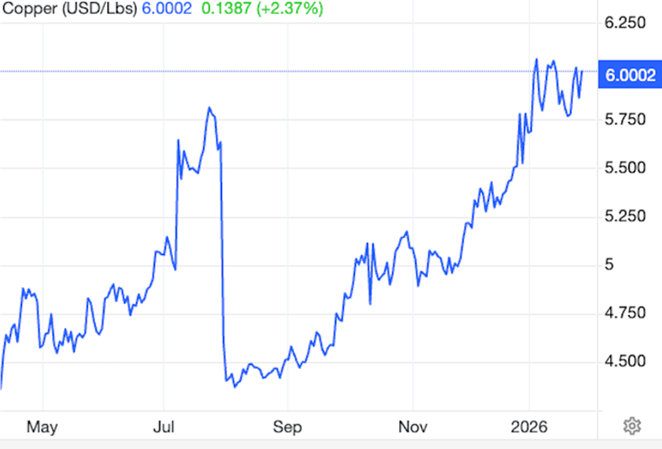
Copper prices cooled in the third week of January as front-month spreads on the London Metal Exchange moved from backwardation into contango, easing market tightness, but were back up over $6 at time of writing Wednesday.
As demand increases and supply is constrained, prices inevitably move higher. This is the case for metals, particularly gold, silver and copper, where supply is not meeting demand, along with energy and agricultural goods.
Another key point is that the “just in time” supply chain is being replaced by the “just in case” scenario, with strategic stockpiling in vitally important commodities becoming the norm.
A prime example of this new paradigm is the US government’s recent move to designate silver, copper, uranium and platinum as critical minerals.
At AOTH, we maintain our long-held view on commodities as a strategic portfolio component, offering protection in an environment marked by fiscal uncertainty, geopolitical risk, and supply-side shocks.
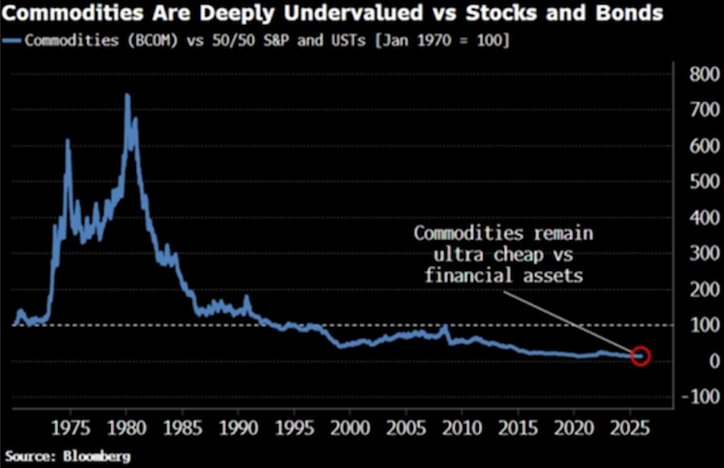
As the chart below shows, commodities are deeply undervalued compared to compared to stocks and bonds. Note the stock market is increasingly vulnerable to a bursting AI asset bubble, making it the perfect time for commodities to outperform financial assets. As inflation continues to hover above the Fed’s 2% target, hard assets climb in real terms, while stocks and bonds, denominated in devalued, unbacked fiat currencies, fall further behind.
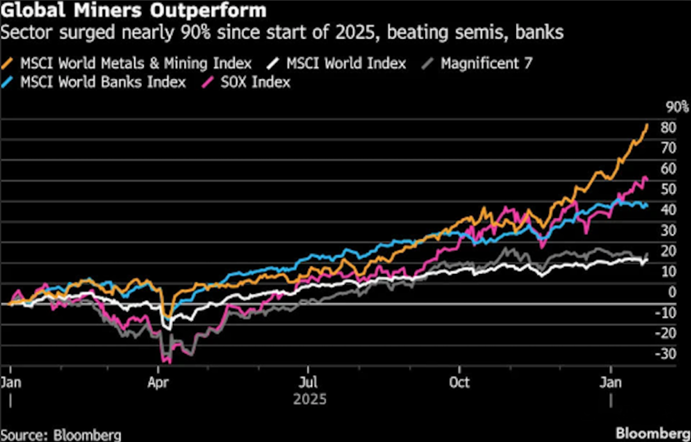
As demand for key minerals soars, driven by electrification and artificial intelligence, hinting at a new commodities super-cycle, global mining stocks are back in vogue.
Bloomberg points out that With a nearly 90% gain since the start of 2025, MSCI’s Metals and Mining Index has beaten semiconductors, global banks and the Magnificent Seven cohort of technology stocks by a wide margin. And the rally shows no sign of stalling, as the boom in robotics, electric vehicles and AI data centers spurs metals prices to ever new highs.
That’s particularly true of copper, which is key to the energy transition and has surged 50% over the same period. But analysts are also bullish on a range of other minerals, including aluminum, silver, nickel and platinum. Gold, meanwhile, is expected to continue benefiting from US monetary and fiscal policy concerns, as well as geopolitical risks, even after hitting successive record highs.
“Mining stocks have quietly moved from a boring defensive sleeve to an essential portfolio anchor — one of the few sectors positioned to capture both shifting monetary policy dynamics and an increasingly volatile geopolitical landscape,” said Dilin Wu, a research strategist at Pepperstone Group Ltd. in Melbourne.
A major driver for the change is that commodities such as copper and aluminum have become less correlated to economic cycles. Historically seen as short-cycle trades, dictated by how fast or slow the world economy is growing, they have gradually morphed into structural investments.
In addition, they are benefiting from transition strategies, where investors buy assets such as metals to gain exposure to the AI theme.
The Stoxx 600 Basic Resources index trades at a forward price-to-book ratio of about 0.47 relative to the MSCI World benchmark. That’s an about 20% discount to the long-term 0.59 ratio and well below prior cycle peaks above 0.7.
“This valuation gap persists even as the strategic relevance of natural resources has risen materially,” Morgan Stanley analysts led by Alain Gabriel wrote.
Gabriel also notes companies’ increasing preference for “buy over build.” Various M&A transactions are underway — notably Anglo American Plc’s acquisition of Teck Resources Ltd. and a potential merger between Rio Tinto Plc and Glencore Plc. While the industry’s capital-intensive nature is driving the trend, Morgan Stanley also attributes it to miners’ willingness to pursue scale and portfolio optimization, particularly in copper.
Given this is happening at a time of supply deficits, the backdrop should support higher commodity prices and valuation multiples, Gabriel added.
Despite significant gains in 2025, miners are still very inexpensive.
Copper
Given our exposure to copper, a separate section on the industrial, and increasingly the electrification metal is warranted.
It’s no secret that there has been a dearth of greenfield copper exploration for decades, and few new copper mines opened.
A new study by the University of Queensland’s Sustainable Minerals Institute shows how reliant mining has become on brownfield expansions, referring to the expansions of existing or past-producing mines rather than brand new discoveries, or Greenfields.
According to the study, the number of new mines peaked around 2015 for copper, in the early 2000s for iron ore, around 2010–2012 for nickel, and around 2012–2014 for gold.
Brownfield capital expenditure is dominated by copper, constituting just under half the total spent followed by gold (17.5%), iron ore (14.4%), and nickel (6.3%).
Copper miners have turned to brown fielding despite lower grades making necessary bigger, deeper and costlier expansions. This isn’t surprising when you consider it takes up to 20 years to bring a new copper mine into production in regulation-heavy jurisdictions like Canada and the United States.
Furthermore, the author of the study says brown fielding often unfolds incrementally over time with less public scrutiny.
Still, even with brownfield projects, there is no guarantee of a successful restart or expansion. According to the study authors, nearly 80% of the brownfield mines analyzed using satellite imagery are in locations facing multiple high-risk conditions, including water scarcity, weak governance, and limited press freedom.
Under the Spotlight – copper in ’26
More than one-fifth of the sites lie within 50 kilometers of ecologically pristine or partially modified areas, and more than half of the sites are located within 20 kilometers of biodiversity hotspots or protected areas.
The Sprott Copper Report identifies five key takeaways:
- Record Copper Prices: Copper hit all-time highs as supply disruptions and structural deficits drove strong repricing.
- Tight Inventories: Regional stockpiling and policy uncertainty are tightening supply outside the US.
- Supply Shocks: Major mine outages and collapsing treatment charges signal severe upstream stress.
- Strategic Demand: AI, defense and grid modernization are making copper demand more durable.
- Key Catalysts: Section 232 tariff risk and rising M&A activity support a constructive 2026 outlook.
The below chart shows copper’s performance as of Dec. 31, 2025. Over the past year, copper junior mining equities led spot copper, copper mining equities, the Broad Commodities index, and US equities, with a gain of 134.2%.
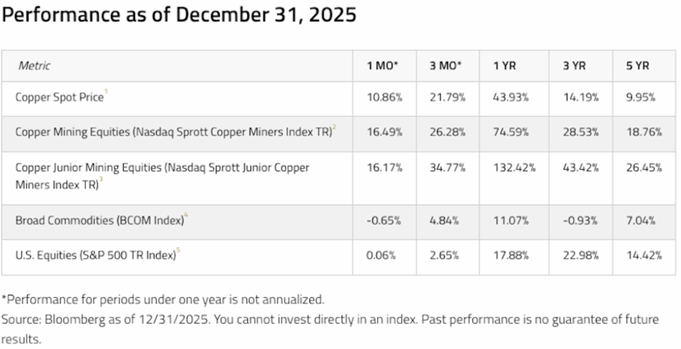
“For junior copper miners, the outperformance also reflects a rising
probability that projects move from optionality to execution as higher prices improve economics and financing viability,” the report states.
Copper rose 43.9% in 2025, with major supply disruptions such as the mud intrusion at Grasberg, flooding at the Kakula mine in the DRC, reduced output guidance by Teck Resources across multiple operations, Codelco’s lower expected production at El Teniente after an accident, and the ongoing shutdown of El Cobre in Panama pushing the market into deficit sooner than expected.
Copper’s strength is also being reinforced by a shift in the mobility of copper inventories. The report states:
“In a more open system, before 2025, exchange stocks and arbitrage help move metal to where it is most needed, smoothing regional imbalances. Today, that mechanism is increasingly constrained by trade frictions and policy uncertainty, which are encouraging stockpiling behavior and redirecting deliverable inventory to specific jurisdictions. This has left U.S. inventories elevated, while availability outside the U.S. is tighter than global headline inventories imply, providing support for the copper market.
The result is a copper market where location, deliverability and policy risk can heighten the impact of the traditional supply-demand balance, particularly when the supply chain is already strained, and deficits are developing earlier than many expected. In effect, copper’s inventory buffer is behaving more like a set of regional pools than a single global reservoir, which helps explain why tightness can persist even when headline inventories do not look extreme.”
An example is what happened to copper in the United States. Despite a Section 232 copper proclamation imposing 50% tariffs on semi-finished copper products, effective Aug. 1, a tariff on refined copper never materialized.
Yet the anticipation of a large duty on refined copper resulted in a race to ship copper to the United States before the tariff kicked in. When refined copper was ultimately exempted, the premium fell back to normal levels, but copper inventories have remained concentrated in the US, as the below graph shows.
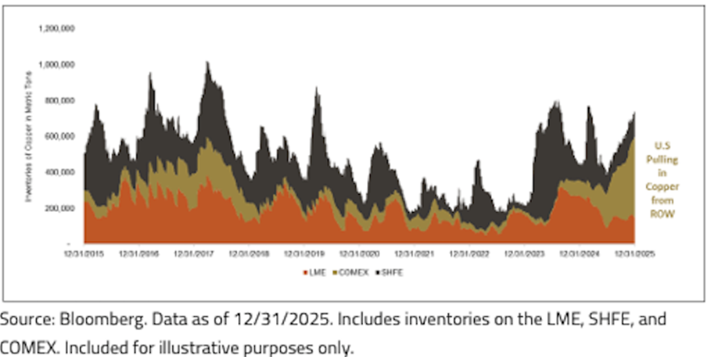
But that isn’t the end of the story. The Trump administration outlined a clear pathway for introducing copper tariffs later, 15% starting on Jan. 1, 2027, increasing to 30% on Jan. 1, 2028.
Indeed, the Trump tariffs have been redrawing world trade, usually sparked by a dressing-down by the US President. The latest targets are South Korea, which Trump said he would increase tariffs from 15% to 25% due to a delay in approving a preliminary trade pact; and Canada, which Trump threatened to slap with 100% tariffs if it signed a free trade deal with China.
Governments and investors need to pay attention to Trump’s “America First” doctrine and the resulting scramble for commodities. Some countries are finding a new way forward by cooperating with each other and excluding the US.
That was the gist of Canadian Prime Minister Mark Carney’s landmark speech at Davos, which called out un-named great powers for trying to make middle powers like Canada subservient.
“The old order is not coming back,” he said. “We should not mourn it. Nostalgia is not a strategy. But from the fracture, we can build something better, stronger and more just.”
Other nations are responding to a more fractured world order, with India and the European Union recently reaching a free-trade agreement.
Conclusion
While some believe that it’s time for the bull market to take a breather and for investors to take some money off the table, I am a firm believer in its strength and continued resilience.
Consider my USANewsGroup.com Market Intelligence Brief summation, one – capital is abandoning pixels for the hard assets you can touch, mine, and measure, and two – the asymmetric advantage belongs to those who control the molecules. Everything else is narrative.
Commodities are indeed the last safe haven standing, in a world that is becoming more disordered, fractured and scary.
Commodities: the last safe haven standing — Richard Mills
Prime Minister Carney was right in that the world has changed, and middle powers can no longer depend on great powers, i.e, the US, for protection and prosperity. Nationalism is front and center, there are regional imbalances in the supply of minerals leading to stockpiling, a synonym for what I’ve always felt will be a mad scramble for commodities once the major miners use up all their reserves and there are no longer any more large mining companies to acquire.
Minerals scarcity naturally leads to higher prices. Gold, silver and copper simultaneously broke records last year for the first time in decades. For those three metals, supply can’t meet demand without recycling, a situation that has existed for the past several years.
We live in a finite resource world where demand is infinite.
The world needs more mines and large and small investors are starting to get it. MSCI’s Metals and Mining Index has beaten semiconductors, global banks and the Magnificent Seven cohort of technology stocks by a wide margin with a 90% gain since the start of 2025.
Over the past year, copper junior mining equities led spot copper, copper producers, the Broad Commodities index, and US equities, with a gain of 134.2%.
2025 was a great year for us at AOTH. We’re expecting more of the same in 2026.
Richard (Rick) Mills
aheadoftheherd.com

Legal Notice / Disclaimer
Ahead of the Herd newsletter, aheadoftheherd.com, hereafter known as AOTH.Please read the entire Disclaimer carefully before you use this website or read the newsletter. If you do not agree to all the AOTH/Richard Mills Disclaimer, do not access/read this website/newsletter/article, or any of its pages. By reading/using this AOTH/Richard Mills website/newsletter/article, and whether you actually read this Disclaimer, you are deemed to have accepted it.


