Inequality: trends and implications – Richard Mills
2023.07.22
Inequality is one of the most volatile aspects of contemporary society, and it is getting worse. As the gap between the haves and the have-nots widens, and the middle class shrinks, the chances of social upheaval increase.
History tells us that a state’s failure to redress rampant inequality can result in bloody revolution.
In this piece, we return to one of our favorite themes, rising inequality. How bad is it and where is it most pronounced? What are its causes and effects? What will drive future inequality?
Economic inequality
First, a couple of definitions. The online Cambridge Dictionary describes inequality as “the unfair situation in society when some people have more opportunities, money, etc. than other people”.
For Investopedia, “economic inequality refers to disparities among individuals’ incomes and wealth.” The investor education website says Forbes counted a record 2,755 billionaires in the world in 2021. In the same year, the World Bank estimated more than 711 million people were living on less than $1.90 per day. While that sounds bad, it’s actually better than in 1990, when over 1.9 billion people lived in extreme poverty and there were only 269 billionaires.
So is inequality getting better or worse, on a global scale? Well, that depends on whether we’re talking about inequality within countries, or between countries.
Inequality within countries
In the United States and around the world, it appears the rich are getting richer rather than the poor are getting poorer. According to The Conversation, in every major region of the world outside Europe, extreme wealth is becoming concentrated in a handful of people.
The Gini coefficient is the way economists measure the income gap. It is calculated by assessing the relative share of national income received by proportions of the population. A society with perfect equality would have a Gini coefficient of 0, whereas a nation with one individual hoarding every penny of its wealth would have a Gini of 1.
Inequality tends to be greater in developing countries than developed ones. The exception is the United States, which in 2021 had a Gini coefficient of 0.494, 1.2% higher than 0.488 a year earlier. The US Gini is quite a bit higher than Denmark’s, which stood at 0.28 in 2019, and France, whose Gini was 0.32 in 2018, according to Census Bureau data.

The Conversation points out that the inequality picture is even worse when looking beyond income (what people earn) to wealth (what they own). In the United States, the richest 1% of Americans own 34.9% of the country’s wealth, while average Americans in the bottom half had USD$12,065. The disparity is greater in the US than in other industrial nations, such as Germany, where the richest 1% own 18.6% of the wealth, or in the UK, where they own 22.6%.
According to the 2022 World Inequality Report, the richest 1% now hold nearly 76% of the world’s wealth, while the bottom 50% own just 2%.
These figures fit with research by The Brookings Institution, which found that contemporary global inequalities are close to the peak levels observed in the early 20th century, sometimes described as The Belle Epoque or The Gilded Age. Brookings says over the past four decades, income inequality has risen across countries, with increases among advanced economies being particularly large in the United States, and among emerging economies, in China, India and Russia.
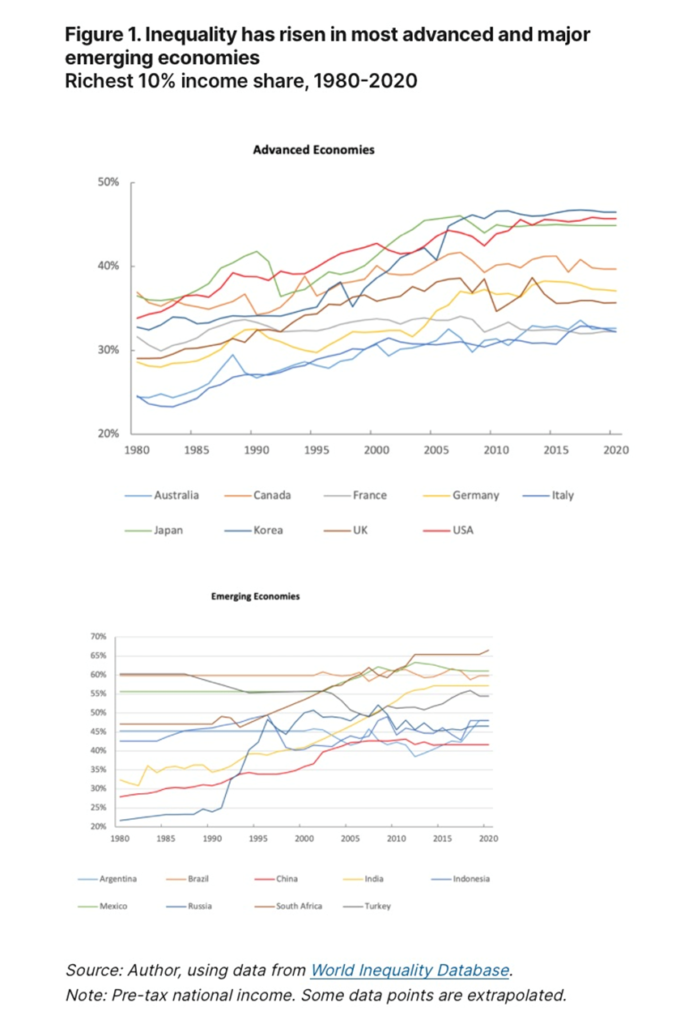
The institution agrees with The Conversation in that wealth inequality within countries is typically much higher than income inequality, following a rising trend since about 1980. Another common finding between the two sources is that the increase in inequality is especially marked at the top of the income distribution, with the share of income among the top 10% and 1% rising sharply.
A Credit Suisse report finds nearly half of global household wealth (47%) is in the hands of just 1.2% of the world’s population. The infographic below shows these 62.5 million individuals control a staggering $221.7 trillion.
At the bottom of the pyramid, 2.8 billion people share a combined wealth of $5 trillion, an amount representing only 1.1% of the global wealth total.
How’s that for the rich getting richer?

Between-country inequality
Interestingly, however, the Brookings research found that inequality between countries, on a per capita basis, has been falling in recent decades. The is due to fast-growing economies like China and India narrowing the income gap with advanced economies like Germany, Britain and the United States. In fact, global inequality — the sum of within-country and between-country inequality — has actually declined somewhat since around 2000, according to Brookings. The narrowing of between-country inequality reflects a rising middle class in emerging economies and a squeezed middle class in rich countries. In a later section we examine the latter trend in the United States.
Drivers
The antecedents of inequality are many and complex, but Brookings simplifies things by divided them into four: rising wage inequality; increased automation; more unequal distribution of capital income; and globalization. Reduced bargaining power among workers and shifting tax policy are two more factors.
A disparity in wages arises as technology shifts labor demand from low-skilled jobs to higher-skilled occupations. With increased automation, wages become decoupled from a firm’s profitability. Another shifting economic paradigm is the unequal distribution of capital income with rising market power and economic rents enjoyed by dominant firms in increasingly concentrated and winner-takes-all markets.
Globalization including off-shoring has contributed to rising inequality by negatively impacting wages and jobs, especially those of lower-skilled workers in advanced economies. Increasingly, this trend is extending beyond manufacturing, as digital globalization expands the range of services delivered across borders.
The Conversation points out that large increases in executive pay are contributing to higher levels of income inequality. Consider: in 1965 the average CEO earned about 20 times the average worker. By 2018, the typical chief executive made 278 times their employees.
According to Oxfam, a new billionaire is created every 26 hours.
It’s important to acknowledge that these days, executive compensation is composed not only of salary but stock options, bonuses and other forms of renumeration. In North America and elsewhere, the wealthy are able to earn interest and capital gains on their investments, which in the US is taxed at a maximum 20%.
How unequal is the US?
Unsurprisingly, income and wealth inequality in the United States is substantially higher than in almost any other developed nation, and is on the rise.
According to the Congressional Budget Office (CBO), inequality has been rising for decades, with the incomes of the highest echelon of earners rapidly outpacing the rest of the population. (Council on Foreign Relations, April 20, 2022). The 10% earning the highest incomes now take home nearly half of all income.

It’s much the same story with wealth, with the top 10% of Americans holding nearly 70% of US wealth, up nine percentage points since 1989. Meanwhile the bottom 50%, or roughly 63 million families, in 2021 owned about 2.5% of the wealth.

The Council on Foreign Relations notes that recent events have exacerbated inequality. The recession of 2007-09 caused incomes to fall and the recovery was uneven. By 2016, the top 10% had more wealth than they did in 2007, and the bottom 90% had less wealth.
While it’s too early to know the effects of the pandemic on inequality, experts quoted by the COFR say the economic turmoil caused by covid-19, including the largest spike in unemployment in modern history, will exacerbate inequality. COFR notes that as workers were being laid off and unlikely to be hired, a boom in stock and home prices primarily benefited wealthy Americans.
A less-studied but interesting phenomenon is how inequality has manifested in different parts of the country. According to the U.S. Department of Commerce, geographic income inequality — the variation in average income across America — has gone up 40% between 1980 and 2021.
Again, it’s not so much that poorer places fell further behind, but that richer locations got richer. In 2021, the highest cost-of-living-adjusted incomes were in Midland, Texas, San Francisco and San Jose, California, Fairfield County, Connecticut, and Naples, Florida.
There is definitely an inequality gap between urban and rural in the US. Incomes are 24% higher in large metropolitan areas than in smaller metropolitan areas, 39% higher than in micropolitan areas, and 51% higher than in counties outside metropolitan and micropolitan areas.
The US middle class is being hollowed out due to rising inequality.
A 2021 Pew Research Center report found that 50% of American adults lived in middle-income households, down from 61% in 1971. This stat is alarming because the middle class has historically been the engine of American economic growth and prosperity, yet over the past five decades it has shrunk.
Perhaps the most interesting part of the Pew report was its finding that the middle class is shrinking not only because more people are poor, but because more people are rich.
Since 1971, the percentage of lowest-income earners has grown four percentage points, from 25% to 29% of the population. Over that same period, the percentage of Americans in the highest-income households rose seven percentage points, from 14% to 21% of the population.
According to Pew, the median income for lower-income households grew slower than that of middle-class households, increasing from $20,604 in 1970 to $29,963 in 2020. The rise in income from 1970 to 2020 was steepest for upper-income households. Their median income increased 69% during that time span, from $130,008 to $219,572. In 2020, the median income of upper-income households was 7.3 times that of lower-income households, up from 6.3x in 1970.
The median income of upper-income households was 2.4x that of middle-income households in 2020, up from 2.2x in 1970.


Taking just the last decade, the data shows that from 2010 to 2020, the median income of the upper class increased 9%, while the median income of the middle and lower classes climbed by only 6%.
Investopedia observes that, If we take a longer view — say, from 2000 to 2021 — we see that only the income of the upper class has recovered from the previous two economic recessions. Upper-class incomes were the only ones to rise over those twenty years.
This segmented rise has contributed to an ongoing trend since the 1970s of the divergence of the upper class from the middle and lower classes. In another piece, Pew reported that the wealth gaps between upper-income families and middle- and lower-income families were at the highest levels ever recorded.
How about the long-held view that America is the land of opportunity, that anyone with grit and determination can climb the social ladder? According to the Council on Foreign Relations, this notion is also eroding. A Harvard economist quoted by the organization found that economic mobility varies widely across the country:
Some wealthy cities have high mobility, on par with countries such as Denmark and Canada, while children in some lower-income areas have less than a 5 percent chance of reaching the top fifth of the income distribution when starting from the bottom fifth.
Overall economic mobility is lower in the United States than in many other developed countries, which some experts argue hampers U.S. economic growth. In a 2016 Stanford University study [PDF], the United States ranked behind several other wealthy countries, including Australia, Canada, France, Germany, and Japan.


Who cares?
Why does any of this matter? It’s part of inequality for those in upper-income brackets to dismiss these findings and carry on as usual. But this would be short-sighted. A concentration of income and wealth reduces demand in the economy because rich households spend less of their income than poorer ones. This leads to lower economic growth.
There is also a good argument that the hollowing out of the middle class has abetted the dissolution of the American family, which has led to a surge in homicides, suicides and drug overdoses.
Finally, there is evidence to prove that rising inequality is eroding trust in democracy and fostering the spread of authoritarian and nativist movements, such as the election of Donald Trump in 2016 and right-wing leaders in Europe.
Extreme political polarization at the federal level, between Democrats and Republicans in the House and Senate, has trickled down to the state legislatures and is starting to endanger the country’s unified market. Examples include Florida Governor Ron DeSantis using his office to try and humble Disney and its “woke agenda”, and California coming out with a new law that could force oil firms to cap their profits.
Outlook
Without government intervention to address inequality — through for example higher taxes on the rich and redistributive policies, both of which are opposed by a large percentage of Americans (and Canadians) — it is likely to persist or rise even further. The COFR notes that artificial intelligence and related new waves of digital technologies and automation could widen the gap between the rich and the poor.
Climate change, says COFR, is another factor that could worsen inequality within and between countries: Low-income groups and countries are more vulnerable to the impacts of climate change and have less capacity to cope with them.
As stated at the top, history tells us that large and unabated rises in inequality can result in bad endings, making it something that governments of all stripes need to keep an eye on.
Richard (Rick) Mills
aheadoftheherd.com
subscribe to my free newsletter
Legal Notice / Disclaimer
Ahead of the Herd newsletter, aheadoftheherd.com, hereafter known as AOTH.
Please read the entire Disclaimer carefully before you use this website or read the newsletter. If you do not agree to all the AOTH/Richard Mills Disclaimer, do not access/read this website/newsletter/article, or any of its pages. By reading/using this AOTH/Richard Mills website/newsletter/article, and whether you actually read this Disclaimer, you are deemed to have accepted it.
Any AOTH/Richard Mills document is not, and should not be, construed as an offer to sell or the solicitation of an offer to purchase or subscribe for any investment.
AOTH/Richard Mills has based this document on information obtained from sources he believes to be reliable, but which has not been independently verified.
AOTH/Richard Mills makes no guarantee, representation or warranty and accepts no responsibility or liability as to its accuracy or completeness.
Expressions of opinion are those of AOTH/Richard Mills only and are subject to change without notice.
AOTH/Richard Mills assumes no warranty, liability or guarantee for the current relevance, correctness or completeness of any information provided within this Report and will not be held liable for the consequence of reliance upon any opinion or statement contained herein or any omission.
Furthermore, AOTH/Richard Mills assumes no liability for any direct or indirect loss or damage for lost profit, which you may incur as a result of the use and existence of the information provided within this AOTH/Richard Mills Report.
You agree that by reading AOTH/Richard Mills articles, you are acting at your OWN RISK. In no event should AOTH/Richard Mills liable for any direct or indirect trading losses caused by any information contained in AOTH/Richard Mills articles. Information in AOTH/Richard Mills articles is not an offer to sell or a solicitation of an offer to buy any security. AOTH/Richard Mills is not suggesting the transacting of any financial instruments.
Our publications are not a recommendation to buy or sell a security – no information posted on this site is to be considered investment advice or a recommendation to do anything involving finance or money aside from performing your own due diligence and consulting with your personal registered broker/financial advisor.
AOTH/Richard Mills recommends that before investing in any securities, you consult with a professional financial planner or advisor, and that you should conduct a complete and independent investigation before investing in any security after prudent consideration of all pertinent risks. Ahead of the Herd is not a registered broker, dealer, analyst, or advisor. We hold no investment licenses and may not sell, offer to sell, or offer to buy any security.

Legal Notice / Disclaimer
Ahead of the Herd newsletter, aheadoftheherd.com, hereafter known as AOTH.Please read the entire Disclaimer carefully before you use this website or read the newsletter. If you do not agree to all the AOTH/Richard Mills Disclaimer, do not access/read this website/newsletter/article, or any of its pages. By reading/using this AOTH/Richard Mills website/newsletter/article, and whether you actually read this Disclaimer, you are deemed to have accepted it.
