2020.06.16
US stock markets are once again gripped by fear and volatility, following a fresh wave of coronavirus infections in China and the US making the headlines.
And while gold prices finished slightly down at the end of trading in New York, Monday, for a number of reasons we’ll get into in this article, the outlook for the precious metal remains bright.
The economic rot settled in last Thursday, when US stocks suffered their worst one-day plunge since March following a two and a half-month run amid the worst public health disaster since the 1918 Spanish Flu. No surprise imo; the froth in the markets has no basis in economic reality.
The selloff was sparked by a US Labor Department report showing that jobless claims were not falling at rates hoped for by Wall Street. More than 42 million Americans have filed for benefits since covid-19 shutdowns began in mid-March. Despite nation-wide attempts at reopening, the country could see a stunning 20% unemployment figure in May.
On Monday stocks continued to falter and the bond market rallied, over worries about a spate of new cases in Beijing, and a fresh round of Chinese negative economic data showed how difficult it is to escape the coronavirus-related downturn, even in a country that appeared to have beaten the deadly respiratory illness.
May’s industrial output and retail sales in China both came in under economists’ expectations.
In the United States, several states are seeing a resurgence of infections and an uptick in hospitalizations. According to Marketwatch, Dallas Fed President Robert Kaplan said Sunday that public health procedures to combat the coronavirus were just as important as government funding for the nascent economic recovery and that, to date, the efforts to reduce coronavirus infections have been “uneven.”
Clearly that wasn’t what the markets wanted to hear.
On Monday the yield on the US 10-year Treasury note slid 3 basis to 0.669%, its biggest weekly drop since March, as investors sought the safety of US sovereign debt, bidding up bond prices and causing yields to fall. Rates on the 2-year and the 30-year notes also dropped. Yields came off their lows after the Federal Reserve announced it would tweak one of its lending programs to enable the central bank to buy a broad basket of corporate bonds.
Stocks opened sharply lower before paring some of their losses, with a 1,000-point swing in the Dow capping off a turbulent day on Wall Street. The other two major stock indices, the S&P 500 and the Nasdaq Composite, both finished in the green.
3 waves of covid
The high volatility of recent days shows just how closely markets are listening to, and responding to, news about the coronavirus. Brokers, hedge funds and other money managers are desperate for some good news to calm the fears of anxious clients.
But they aren’t getting it.
Last week Texas and Florida – two of the first states to reopen – both hit daily highs of covid-19 cases, along with California. Infection rates in Arkansas, Alabama, North Carolina, South Carolina, Utah and Alaska also surged.
Forbes reported on Friday the results of the Centers for Disease Control’s new forecast that singled out six states where the death toll is expected to rise over the next month: Arizona, Arkansas, Hawaii, North Carolina, Utah and Vermont.
Many Americans either aren’t getting the message about social distancing or aren’t listening, preferring to follow the lead of US President Trump and Vice President Mike Pence who consistently walk around un-masked and denounce those taking precautions.
As states eased up on restrictions, Memorial Day weekend festivities attracted large crowds, with many flocking to beaches, bars and pool parties in the Lake of the Ozarks, Missouri, while forgoing rules on social distancing and wearing masks in public. Large public gatherings including church services are not being prevented.
New York Gov. Andrew Cuomo has threatened to reinstate closings in areas where local governments fail to enforce the rules, the Globe and Mail said. The latest data shows over 2.1 million Americans have contracted covid-19 and more than 118,000 have died.
I’ve said all along that there would be a resurgence of covid in the United States. Re-openings there are a jumble, with each state doing its own thing and the federal government offering only guidelines not rules. A failure to adequately test and contact trace have made it worse. How do you stop the virus from spreading if you don’t know where it is?
In fact I believe there will be three waves of coronavirus: The first wave that happened in mid-March, the second wave, call it the “boomerang effect” of cases returning due to states and cities reopening too soon, and a third wave in the fall, after warm weather and the sun’s UV rays give way to colder temperatures and the virus is allowed to infiltrate human hosts – a lethal mix of covid and flu.
Gold and the money supply
The US government and policymakers around the world have no choice but to unfurl massive stimulus programs to help their citizenries to deal with the worst recession since World War II.
Governments that don’t have the funds to pay for these programs have two choices: print money or borrow it. Money-printing is inflationary, so most choose to borrow, especially with interest rates at record lows.
The $2.2 trillion relief package Trump signed into law on March 27 is just the beginning, with the Treasury Department now seeking $250 billion more for small business loans. If House Democrats and the president can agree on a Phase 4 spending deal, targeting infrastructure, that would mean another $2 trillion.
As of May 15, the Economic Times of India reported central banks and governments worldwide had unleashed $15 trillion of stimulus, via bond-buying and spending. Up to 285 stimulus measures have been passed over the past eight months, including Japan, which approved a $1 trillion relief package in early April.
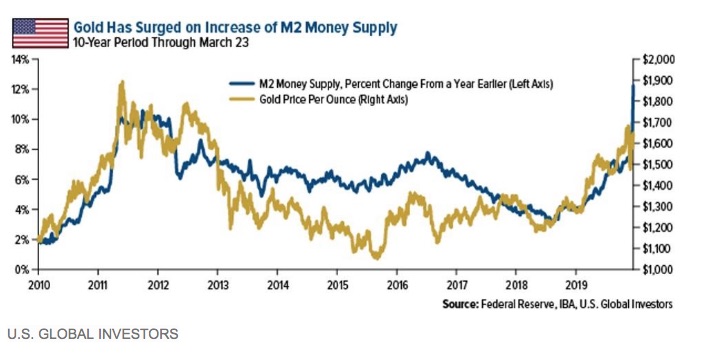
Frank Holmes, CEO of US Global Investors, has noticed the tight correlation between the money supply, or M2, and gold prices. In an April column, Holmes writes,
The U.S. economy is being flooded with excess money and liquidity right now. Compared to the same period a year ago, M2 money supply––which includes not just cash but also savings deposits, money market funds and other “near” money––has increased some 12 percent, the most in more than 10 years.
All this excess liquidity has to go somewhere, and historically it’s acted as Miracle-Gro for gold prices. Look at the chart below. There’s a clear correlation between the annual growth rate in M2 money supply and the price of the yellow metal. In the times when money supply surged from the same period a year earlier, gold prices followed.
Indeed the popularity of gold among investors is reflected in the amount of inflows into gold-backed exchange traded funds. In the first quarter, gold ETFs hit an all-time high of 298 tonnes, valued at $23 billion, which according to the World Gold Council is the highest ever for a single quarter and the most tonnage since Q1, 2016.
WGC states, “With the Fed taking interest rates to zero for the foreseeable future, gold could do well as it tends to outperform during easing cycles. Additionally, multi-trillion dollar fiscal stimulus policies to combat the economic impact of COVID-19 could prove inflationary – a development that could support gold prices in the long run.”
In a normal business cycle, this is what would happen.
Lower interest rates and massive asset purchases by central banks are the monetary tools of choice when it comes to restoring shocked financial systems. The idea being that making the cost of borrowing cheap for individuals and businesses will entice them to spend, spend, spend.
However because consumer spending, which makes up a full two-thirds of the US economy, has effectively been throttled due to government-ordered lockdowns (and as stated, economy reopenings are failing), consumers are too scared to spend.
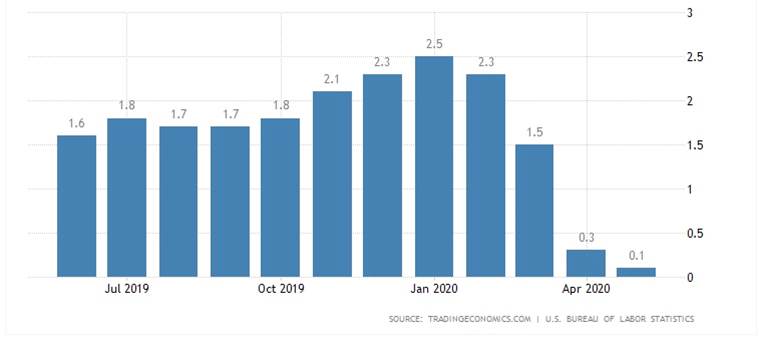
In a previous article we predicted we would get deflation before inflation and this is exactly what is happening. US inflation is now the lowest since September 2015, falling from 2.5% in January to 0.1% in May. Trading Economics says the drop in prices is mainly due to a 33.8% plunge in the cost of gasoline.
Back to gold and the money supply, “Mish Talk” was curious as to whether the correlation pointed out by Frank Holmes holds true over time. It doesn’t.
In a recent column, Mish put together a FRED chart showing that, plotted since 1970, there is no relationship between M2 change in the money supply, in blue, and gold prices, in red – except for a brief period during the past decade, when the two lines merge. There starts to be a correlation 10 years ago but the trend broke down around 2017-18.
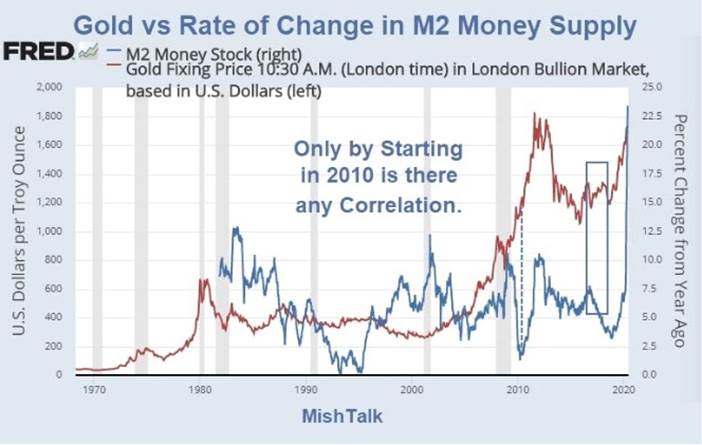
Recent correlation, and lack of previous relationship, between M2 money supply and gold, is due to the tremendous amount of debt foisted upon the financial system over the past decade.
Gold and debt
In a previous article we discussed the close relationship between gold and the debt to GDP ratio. Historically, we know that as the percentage of debt to GDP rises, so does gold. For a reminder of how this works, look at the FRED chart below.
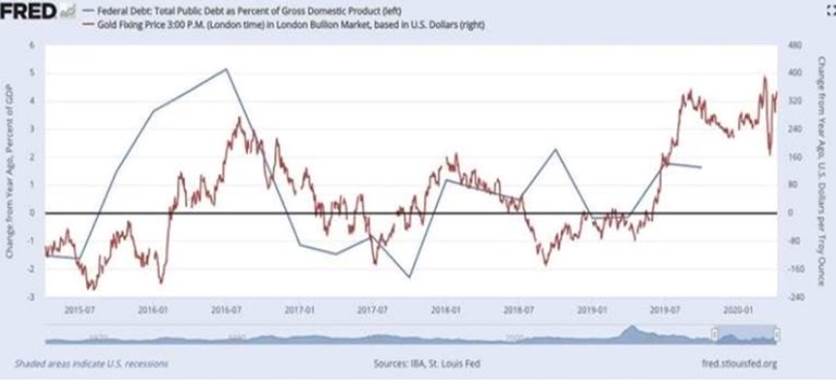
The Commerce Department reported gross domestic product, the broadest measure of economic health, fell 5% in the first quarter, an even bigger decline than the 4.8% previously estimated. The Atlanta Fed projects economic growth during the second quarter to contract 41.9%!
That is the GDP side of the equation. On the debt side, covid crisis emergency stimulus measures include at a minimum, $2 trillion in new spending, and possibly doubling the Fed’s balance sheet to $10 trillion. As of May 20, the Federal Reserve balance sheet stood at a record $7.09 trillion.
Consider what a $10 trillion Fed balance sheet will do to the debt-to-GDP ratio. Consider what it will do to gold. Already at 106.5%, a level not seen since World War II, it’s not inconceivable for the ratio to spike to $150%, or 200%. That would mean for every dollar the US economy produces, it has to borrow $1.50, or $2.00. That’s insane.
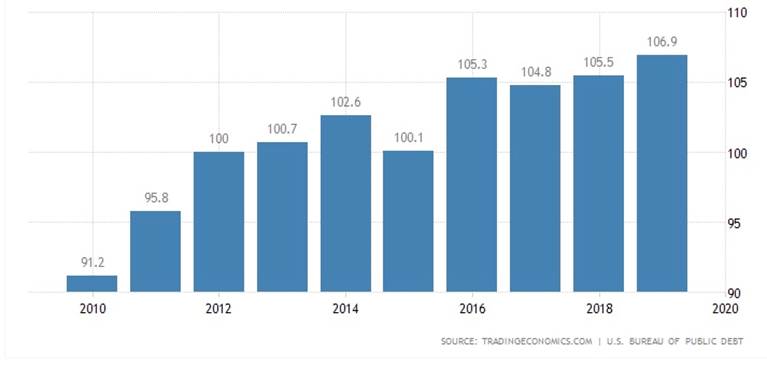
According to the World Bank, countries whose debt-to-GDP ratios are above 77% for long periods experience significant slowdowns in economic growth. Every percentage point above 77% knocks 1.7% off GDP, according to the study, via Investopedia.
In 2019 the global debt to GDP ratio hit an all-time record of 322%. The Institute of International Finance in January predicted that total global debt will exceed $257 trillion in 2020, and that was before the coronavirus.
We have more evidence of US debt levels getting out of control. According to Wolf Street, in the five weeks to June 8 the national debt spiked $1 trillion, to $26 trillion. The US government pays a billion dollars a day in interest to service this humongous pile of loans.
Wolf Richter writes,
Trillions are now whooshing by at a breath-taking pace…
On February 19, when the debt had soared by $1.3 trillion in 12 months to $23.3 trillion, I mused: “But these are the good times. And we don’t even want to know what this will look like during the next economic downturn.”
Turns out, we didn’t get a regular economic downturn. We got the most epic and sudden economic downturn ever. And now we’re beginning to know what this looks like in terms of the US debt.
From early March through its balance sheet released yesterday, the Fed added $1.61 trillion in Treasury securities to its assets as part of its Everything Bubble bailout program. Over the same period, the US debt soared by an additional $2.5 trillion. The Fed has thereby indirectly – as is the rule in the US – monetized 65% of this additional debt.
The Congressional Budget Office expects the federal budget deficit (the gap between revenue and expenses over one year) to hit $3.7 trillion by the end of the fiscal 2020 – nearly five times the current deficit at the halfway point.
It’s a similarly depressing story for business debt and consumer debt. Both are rising exponentially. According to the Fed’s Board of Governors, total business debt in the first quarter jumped to $16.86 trillion – the 5% increase from Q4 2019 is the largest quarter to quarter increase since the 1950’s. Commercial and industrial loans spiked 29% in three months, the most ever.
I want to correct something I said earlier: Consumer spending hasn’t increased during this pandemic, but deficit spending sure has. Household debt including credit cards, car loans and student loans hit a record $16.3 trillion in the first quarter, up 12% from the darkest days of the financial crisis in the third quarter of 2018.
All told, the Fed’s Board of Governors calculates $55.9 trillion in “non-financial debt, (including government, business and household debts) in the first quarter of 2020 will likely approach $60 trillion by the end of June. In Wolf Richter’s words, having doubled in the 14 years since 2006. Debt out the wazoo.
Low rates till 2022
It certainly seems that the US Federal Reserve, and other central banks of countries struggling with the coronavirus, are locked into this spiral of stimulus spending of “Debt out the wazoo” leading to astronomical levels of borrowing leading to high debt to GDP ratios, resulting in higher gold prices.
Key to this conundrum is low interest rates, upon which all borrowing is based. Rates are expected to remain low for at least the next two years. On June 12 CNBC reported,
The Fed offered no additional policy tools to help guide the economy through what promises to be a murky road ahead, only assurances that short-term benchmark interest rates would remain anchored near zero through at least 2022.
If all of this stimulus we are seeing finally results in consumers spending again, say with the release of a vaccine, we are likely to see prices rise, big time. Inflation + low interest rates = higher gold.
The longer stimulus measures continue, and GDP growth falls, along with a creeping expansion of the Fed’s balance sheet and negative real interest rates (interest rates minus inflation) which are always bullish for gold, we see no reason to doubt that gold prices will keep climbing.
Conclusion
Combine all the economic turbulence surrounding the coronavirus, with multiple geopolitical hot spots, including allegations of spying between Russia and China over Arctic submarines, rising tensions in the South China Sea, an arms race of mid-range nuclear weapons, China/ India tensions, racial tensions, wealth/ social inequality and Iran preventing inspectors from accessing sites thought to store nuclear material, and you have a lot of good reasons to own gold, or quality gold juniors that historically have offered the best leverage to rising gold prices.
Richard (Rick) Mills
subscribe to my free newsletter
aheadoftheherd.com
Ahead of the Herd Twitter
Legal Notice / Disclaimer
Ahead of the Herd newsletter, aheadoftheherd.com, hereafter known as AOTH.
Please read the entire Disclaimer carefully before you use this website or read the newsletter. If you do not agree to all the AOTH/Richard Mills Disclaimer, do not access/read this website/newsletter/article, or any of its pages. By reading/using this AOTH/Richard Mills website/newsletter/article, and whether or not you actually read this Disclaimer, you are deemed to have accepted it.
Any AOTH/Richard Mills document is not, and should not be, construed as an offer to sell or the solicitation of an offer to purchase or subscribe for any investment.
AOTH/Richard Mills has based this document on information obtained from sources he believes to be reliable but which has not been independently verified. AOTH/Richard Mills makes no guarantee, representation or warranty and accepts no responsibility or liability as to its accuracy or completeness. Expressions of opinion are those of AOTH/Richard Mills only and are subject to change without notice. AOTH/Richard Mills assumes no warranty, liability or guarantee for the current relevance, correctness or completeness of any information provided within this Report and will not be held liable for the consequence of reliance upon any opinion or statement contained herein or any omission. Furthermore, AOTH/Richard Mills assumes no liability for any direct or indirect loss or damage or, in particular, for lost profit, which you may incur as a result of the use and existence of the information provided within this AOTH/Richard Mills Report.
AOTH/Richard Mills is not a registered broker/financial advisor and does not hold any licenses. These are solely personal thoughts and opinions about finance and/or investments – no information posted on this site is to be considered investment advice or a recommendation to do anything involving finance or money aside from performing your own due diligence and consulting with your personal registered broker/financial advisor. You agree that by reading AOTH/Richard Mills articles, you are acting at your OWN RISK. In no event should AOTH/Richard Mills liable for any direct or indirect trading losses caused by any information contained in AOTH/Richard Mills articles. Information in AOTH/Richard Mills articles is not an offer to sell or a solicitation of an offer to buy any security. AOTH/Richard Mills is not suggesting the transacting of any financial instruments but does suggest consulting your own registered broker/financial advisor with regards to any such transactions
Legal Notice / Disclaimer
Ahead of the Herd newsletter, aheadoftheherd.com, hereafter known as AOTH.Please read the entire Disclaimer carefully before you use this website or read the newsletter. If you do not agree to all the AOTH/Richard Mills Disclaimer, do not access/read this website/newsletter/article, or any of its pages. By reading/using this AOTH/Richard Mills website/newsletter/article, and whether you actually read this Disclaimer, you are deemed to have accepted it.
