Gold Lagging Inflation
- Home
- Articles
- Metals Precious Metals
- Gold Lagging Inflation
2022.01.14
Adam Hamilton, CPA
Gold is lagging the raging inflation unleashed by the Fed’s epic money printing. Despite leading inflation benchmarks skyrocketing to multi-decade highs, gold prices have barely budged. Serious inflation initially fuels record-high stock markets, which stunt gold investment demand. But festering inflation increasingly erodes corporate earnings, hitting stock prices. As stock markets roll over, gold will start reflecting this inflation.
Runaway inflation is increasingly plaguing the United States, as evident in this week’s major economic releases. The December Consumer Price Index headline number came in up 7.0% year-over-year, its hottest print since June 1982! That’s a 39.5-year high, despite the CPI being intentionally lowballed by the government to mask inflation. Fast-rising general prices slash standards of living, angering American voters.
This latest CPI report claimed food and shelter costs only climbed 6.3% and 4.1% over this past year. Is that your experience? The actual increases in grocery bills, housing, and rent costs have likely soared at triple-to-quadruple those pretend trajectories. Leading into this latest CPI release, new research from Bank of America reported food, housing, and rent prices have blasted about 27%, 18%, and 12% higher YoY!
Shelter accounts for about a third of the CPI, which is held artificially-low through a fiction called owners’ equivalent rent. That is just a survey asking homeowners to guess how much they’d expect to pay to rent a house of similar quality! Most Americans who aren’t real-estate professionals wouldn’t have a clue on that. The CPI is full of similar statistical trickery instead of using honest hard free-market data on prices.
The December Producer Price Index showing wholesale price trends looked even worse, soaring 9.7% YoY! That was a record high in this current PPI iteration. Far more inflation is baked into the pipeline, as an intermediate-demand PPI subindex rocketed up 24.4% YoY! These soaring input costs are cutting into corporate earnings, and will ultimately be passed along to customers driving more price increases.
Government officials are blaming this crazy inflation on supply-chain snarls, which is pure misdirection. As legendary American economist Milton Friedman warned way back in 1963, “Inflation is always and everywhere a monetary phenomenon.” When money supplies are ramped faster than economies’ goods and services, relatively-more money competing for relatively-less things to spend it on bids up their prices.
Central banks directly control money supplies. In the past 22.3 months since March 2020’s pandemic-lockdown stock panic, the Fed has mushroomed its balance sheet an insane 110.8% higher or $4,607b! By directly monetizing $3,187b of US Treasuries and $1,243b of mortgage-backed bonds, the Fed has effectively more than doubled the US-dollar monetary base! Such extreme excess is wildly-unprecedented.
All those trillions of dollars the Fed conjured out of thin air to buy bonds were quickly spent, injecting that vast deluge of new money into the real economy. With monetary growth greatly exceeding underlying economic growth, prices of almost everything are surging to reflect vast oceans of new dollars sloshing around. Except gold’s, history’s premier inflation hedge has largely slept through this money-printing orgy.
When the Fed first redlined its printing presses in that stock panic, gold did surge dramatically powering 40.0% higher over the next 4.6 months. But the huge investment-capital inflows fueling that massive upleg left gold extremely-overbought in August 2020, so it has mostly been consolidating sideways ever since. That has created an enormous pennant chart formation on the verge of an imminent forced breakout.
That should spawn a major new bull-market upleg where gold will start reflecting the more-than-doubled US-dollar supply. But for now, gold is really lagging the Fed’s raging inflation. This chart superimposes real inflation-adjusted gold prices over the year-over-year changes in the CPI during this metal’s secular bull. These real gold prices are CPI-calculated, while gold’s gains and losses are shown in nominal terms.
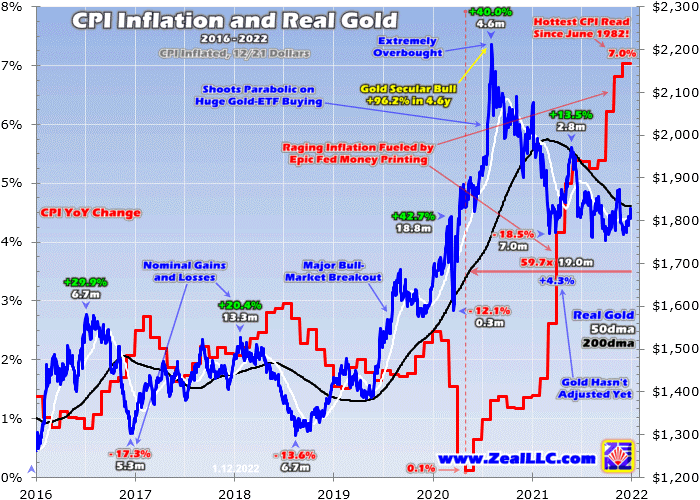
Gold’s current secular bull was born in December 2015, incidentally the day after the Fed launched its last rate-hike cycle. Since then gold has powered 96.2% higher at best over 4.6 years as of August 2020. That big post-stock-panic upleg catapulted gold to an all-time nominal high of $2,062. But in real inflation-adjusted terms, gold had been much higher the last time inflation was so out-of-control four decades earlier.
In this bull’s first 4.2 years into February 2020, headline inflation wasn’t an issue. The monthly CPI report averaged modest 1.9%-YoY gains in that span. Gold’s usual drivers were responsible for its meanderings then, speculators’ leveraged gold-futures trading and investors’ gold-investment demand. The latter was retarded by US stock markets climbing to record highs in much of that time, leaving gold languishing out of favor.
Reported inflation started collapsing in March 2020 on governments’ draconian COVID-19 lockdowns and the resulting stock panic. By a couple months later in May, CPI inflation had shriveled up to just +0.1% YoY. Gold averaged $1,719 that month when Fed officials feared lockdowns would spawn deflation and a full-blown depression. So to ward that off they had spun up their monetary printing presses to lightspeed.
Through March, April, and May that year alone, the Fed monetized $1,635b of US Treasuries shooting its balance sheet 70.7% or $2,939b higher! That epic monetary spewing sowed the seeds for today’s ruinous inflation. Rather than start removing that extreme monetary excess as the stock markets soared and the economy recovered, the Fed kept the pedal to the metal. Its balance sheet kept on relentlessly growing.
But the CPI didn’t reflect that colossal money printing right away, averaging just 1.4%-YoY increases from June 2020 to March 2021. Economies can only absorb big money-supply changes gradually, so it takes time for prices to adjust to them. But with the CPI surging 4.2% YoY in April, it was becoming apparent the Fed’s record flood of new money was starting to bid prices higher. Fed officials argued inflation was “transitory”.
Boy were they wrong! From April to December 2021, even the intentionally-lowballed CPI had headline prints surging 4.2%, 5.0%, 5.4%, 5.4%, 5.3%, 5.4%, 6.2%, 6.8%, and 7.0% YoY. This raging inflation is becoming so politically-damaging to the government that drastic measures will soon be taken to hide it. The Bureau of Labor Statistics responsible for the CPI is changing its methodology starting with the next report.
Back at the end of August, the BLS said “Starting in January 2022, weights for the Consumer Price Index will be calculated based on consumer expenditure data from 2019-2020. The BLS considered interventions, but decided to maintain normal procedures.” Whatever this means, there’s no doubt it will lead to lower claimed inflation based on the BLS’s long track record of obscuring inflation rather than reporting it.
But regardless of what government statisticians claim to keep their political bosses happy, Americans running households and businesses know exactly what their own real-world costs are doing. My wife and I are shocked at how much more money it takes to maintain our family’s standard of living. I’ve talked with dozens of friends and heard from hundreds of subscribers about inflation, and they all feel the same way.
But gold isn’t yet reflecting this new world with vastly more dollars bidding up prices universally. In December as even this fake CPI up 7.0% YoY revealed the hottest price increases since June 1982, gold only averaged $1,792. In this 19.0-month span where the headline CPI inflation rate exploded 59.7x higher, monthly-average gold prices merely edged up 4.3%. That is terrible performance given this monetary backdrop.
Again a couple major factors explain gold’s lack of response to this raging inflation so far. That summer-2020 rocketing to all-time nominal highs left gold extremely-overbought, so it needed to suffer a normal and healthy major correction to rebalance sentiment. And the record-high stock markets directly fueled by the Fed’s extreme monetary deluge slayed interest in prudently diversifying stock-heavy portfolios with gold.
But gold’s high consolidation has run its course with that major breakout imminent, both sentiment and technicals call for gold’s next bull upleg to soon start marching. And these money-printing-levitated stock markets trading at dangerous bubble valuations are in a world of hurt as persistent price increases cut into both corporate earnings and revenues. Gold investment demand will roar back as stock markets weaken.
The great majority of investors today don’t remember how gold really fares in inflationary times driven by Fed monetary excesses. The US economy hasn’t faced similar bouts of serious inflation since way back in the 1970s to early 1980s. To be old enough to be investing then, traders would have to been born by the mid-1950s. So no one under retirement age now has ever experienced anything like today’s inflation!
That includes me, a mid-1970s baby. Thus before assuming gold won’t respond to the Fed’s radically-unprecedented monetary excesses of the last couple years, it is prudent to see how gold fared the last time inflation ran this hot. So this next chart applies this same headline-CPI-YoY and CPI-adjusted-real-gold methodology to the 1970s. Gold has a long track record of incredible performance in inflationary times!
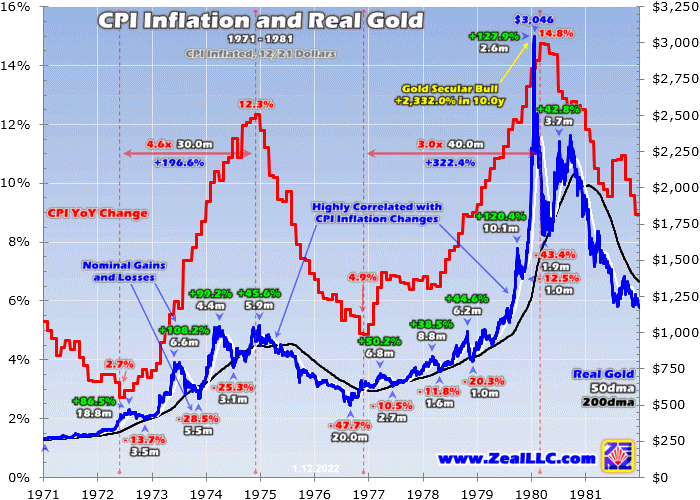
In real-inflation-adjusted terms, gold’s all-time high of $3,046 in today’s dollars came in January 1980. That capped a gargantuan 10.0-year secular bull where gold skyrocketed up a legendary 2,332.0%! A major driver of those life-changing gains was the raging inflation of that time. Note the high correlation between gold price trends and CPI-YoY changes during that decade. Gold mostly followed inflation in lockstep.
The 1970s saw two serious headline-inflation spikes, the first peaking in December 1974 at a +12.3%-YoY CPI. That inflation acceleration ran 30.0 months, ultimately catapulting the annual CPI increase 4.6x higher. In monthly-average terms between the CPI’s +2.7% starting month and +12.3% ending month, gold prices soared 196.6% higher. The yellow metal nearly tripled during the 1970s’ first serious inflation!
Gold was certainly volatile within that highly-inflationary span, enjoying enormous uplegs followed by big bear-level corrections. But overall gold was a fantastic investment while inflation ravaged stock markets. For comparison between that June 1972 CPI trough and December 1974 CPI peak, the flagship S&P 500 US stock index collapsed 37.9% in monthly-average terms! Gold is the place to be during serious inflation.
While today’s 7% CPI price increases sound much milder than the mid-1970s 12% ones, realize the CPI decades ago was more honest. Bureaucrats were nowhere near as pressured by politicians to fabricate and heavily massage data to make government policies look better. Since the 1970s the CPI has been changed many times, all lowering reported inflation. Today’s CPI would be way higher with 1970s’ methodologies!
Consider that owners’-equivalent-rent farce alone. The third of the current CPI accounting for shelter is again reported at mere 4.1%-YoY growth. Various market measures of rents and US-house prices are showing increases from 12% to 20% YoY. Around the middle near 16%, that is still quadruple the BLS’s ludicrous shelter-price claim. Just 16% shelter alone would catapult today’s overall headline CPI to +11.0% YoY.
Most inflation-studying economists who aren’t employed by Wall Street to pump and rationalize bubble-valued stock markets agree that real-world inflation today is much higher than the CPI indicates. OER is just one component of that lowballing. Another is medical expenses, with the BLS now claiming medical costs have only risen by 2.5% YoY! Can you imagine medical bills ever not rising an order of magnitude more?
That 1970s secular gold bull actually suffered a multi-year bear as inflation rates backed off in the middle of that decade. Gold didn’t start marching higher again in late 1976 until CPI disinflation stalled. Then as inflation started surging again, gold was off to the races in a mighty run that would ultimately climax in a famous popular speculative mania. Gold’s gains were enormous as money-printing-driven inflation soared.
The headline CPI started up 4.9% YoY in November 1976, but ultimately soared to a soul-crushing 14.8% in March 1980. The pace of inflation soared 3.0x over that long 40.0-month span. That worked wonders for gold investment demand, which fueled enormous 322.4% gains in monthly-average gold prices during that serious-inflationary bout! Gold more than quadrupled the last time runaway inflation racked the US!
Already deeply-undervalued from their early-1970s inflationary pummeling, the US stock markets didn’t plunge much farther. But in monthly-average terms from that late-1970s CPI trough to peak, the S&P 500 still only eked out a 3.5% gain. Gold was a vastly-superior investment when inflation last ran at super-hot levels similar to today. Sooner or later stock investors will figure that out and diversify their stock-heavy portfolios.
Gold investment now is effectively zero, so it won’t take much of a reallocation to drive gold prices far higher. Exiting December, those elite S&P 500 stocks averaging a dangerous-bubble 33.6x trailing-twelve-month price-to-earnings ratio had a collective market capitalization of $43,000.3b. Meanwhile the combined holdings of the dominant GLD and IAU gold exchange-traded funds were worth just $85.5b.
This proxy of American stock investors’ percentage allocation to gold was vanishingly-small under 0.2%. For centuries 5% to 10% in gold was considered the minimum prudent amount, because gold tends to rally when stock markets weaken. If Americans even diversify enough to bring this allocation measure up to 2.0%, that huge demand will catapult gold way higher. Gold has lots of room to run in its current small bull.
Again up 96.2% at best, that’s only about 1/24th the size of the 1970s’ inflationary super-bull. Since the gold market is vastly larger today, we aren’t going to see 2,300%+ gains again. But 200% to 300% isn’t a stretch at all given the Fed’s epic monetary deluge in recent years. This raging inflation will persist until the Fed hikes its federal-funds rate way above CPI inflation rates or drastically shrinks its bloated balance sheet.
Neither is going to happen, because either would crash these bubble-valued stock markets. At the latest FOMC meeting, Fed officials forecast three quarter-point hikes each in both 2022 and 2023. That would take the federal-funds rate to 1.5% by the end of next year. That won’t even faze serious inflation. During those December 1974 and March 1980 peak-CPI-inflation months, the FFR averaged 8.7% and 17.2%!
And that $4,607b of quantitative-easing money printing since March 2020 isn’t going to be meaningfully unwound no matter how tough Fed officials talk. It’s no coincidence the S&P 500’s 114.4% gain at best since then closely matches that epic 110.8% balance-sheet expansion. While the Fed might find the courage to dabble in quantitative tightening, it would wreak havoc on these QE-levitated bubble stock markets.
If the Fed can’t fight this raging inflation it unleashed without spawning a brutal stock bear that would at least maul stock prices in half, it won’t. That means interest rates will stay abnormally-low and the Fed’s balance sheet will remain grotesquely-bloated, allowing this inflation to fester for years. That is really bearish for stock markets and super-bullish for gold. Make no mistake, gold won’t keep lagging inflation for long!
The biggest beneficiaries of much-higher gold prices ahead are the fundamentally-superior mid-tier and junior gold stocks. They rallied sharply with gold into mid-November, but were dragged back down to their stop losses by another bout of heavy gold-futures selling. Our stoppings averaged out to neutral, fully recovering our capital. So we’ve been aggressively redeploying buying back in low in our newsletters.
If you regularly enjoy my essays, please support our hard work! For decades we’ve published popular weekly and monthly newsletters focused on contrarian speculation and investment. These essays wouldn’t exist without that revenue. Our newsletters draw on my vast experience, knowledge, wisdom, and ongoing research to explain what’s going on in the markets, why, and how to trade them with specific stocks.
That holistic integrated contrarian approach has proven very successful. All 1,247 newsletter stock trades realized since 2001 averaged outstanding +21.3% annualized gains! Today our trading books are full of great fundamentally-superior mid-tier and junior gold, silver, and bitcoin miners to ride their uplegs. Their recent realized gains into stoppings have run as high as +63.3%. Subscribe today and get smarter and richer!
The bottom line is gold is only lagging inflation temporarily. Fed-levitated record-high stock markets have retarded gold investment demand, while the yellow metal consolidated high after massive mid-2020 gains. But this serious inflation will increasingly erode corporate earnings, forcing bubble-valued stock prices much lower. And gold is nearing a major forced breakout from a gigantic bullish technical chart formation.
So gold prices should soon start reflecting this raging inflation unleashed by the Fed’s extreme monetary excesses. Gold soared by multiples during the last serious-inflation bouts in the 1970s as stock investors diversified into it. And since the Fed can’t hike rates high enough to fight today’s inflation without crashing these bubble-valued stock markets, high-and-rising prices are likely to continue festering for years to come.
Adam Hamilton, CPA
Legal Notice / Disclaimer
Ahead of the Herd newsletter, aheadoftheherd.com, hereafter known as AOTH.Please read the entire Disclaimer carefully before you use this website or read the newsletter. If you do not agree to all the AOTH/Richard Mills Disclaimer, do not access/read this website/newsletter/article, or any of its pages. By reading/using this AOTH/Richard Mills website/newsletter/article, and whether you actually read this Disclaimer, you are deemed to have accepted it.

