Gold industry must find 8Moz to avoid supply deficit: Woodmac

2020.06.20
Commodities consultant Wood Mackenzie has just reported what we at Ahead of the Herd have known for years: the gold industry has reached peak gold.
The concept of peak gold should be familiar to most readers, and gold investors. Like peak oil, it refers to the point when gold production is no longer growing, as it has been, by 1.8% a year, for over 100 years. It reaches a peak, then declines.
Peak gold doesn’t necessarily mean gold production will suffer a major fall. However it does mean the mining industry lacks the capacity to ramp up production to meet rising demand; even higher prices would not make that happen, because there aren’t enough mines to tap for more supply.
The idea of peak gold has always been controversial and continues to be. If the amount of reachable, and economic gold resources is finite, presumably gold companies have a shelf life. It means gold mining is a sunset industry that will only see so many more bright orange spheres slipping over the horizon before the last ounce of gold is poured.
If gold is indeed becoming scarcer, prices have only one way to go and that’s up, so long as demand for the precious metal is constant, or growing.
For intelligence on peak gold, we turn to hard evidence, such as reports by McKinsey & Company, the World Gold Council, S&P Global Intelligence, and Wood Mackenzie.
In its latest report, Woodmac says to avoid a perpetual decline in mined gold, the industry must see a rise in the number of gold projects under development that have a good chance of becoming mines.
How many projects? 44, to be exact. The research firm crunched the numbers, and found that by 2025 the industry will need to commission 8Moz of projects, meaning an investment of about $37 billion over the next five years.
Intuitively, that seems virtually impossible – @ nearly 9 projects a year, proving up 5.5Moz per year. Wood Mackenzie agrees.
“If all our probable projects were to come online before 2025, this would almost meet the requirement to maintain 2019 production levels,” said Rory Townsend, Wood Mackenzie’s head of Gold Research.
“The likelihood, however, is that we see some degree of slippage among a number of these assets due to permitting delays, prioritization of other capital projects and changes in scope,” said Townsend.
Consider: in the 1970s, ‘80s and ‘90s, the gold industry found at least one +50 Moz gold deposit and ten +30Moz deposits. Since 2000, no deposits of this size have been found, and very few 15Moz deposits.
Don’t believe us? Here’s Ian Telfer, former Goldcorp chairman, and gold industry expert, giving his argument for peak gold, in 2018:
“In my life, gold produced from mines has gone up pretty steadily for 40 years. Well, either this year it starts to go down, or next year it starts to go down, or it’s already going down… We’re right at peak gold here.”
It’s not surprising that gold companies are finding it tougher to add to global reserves. The fact is, all of the easy, low-hanging fruit has been picked.
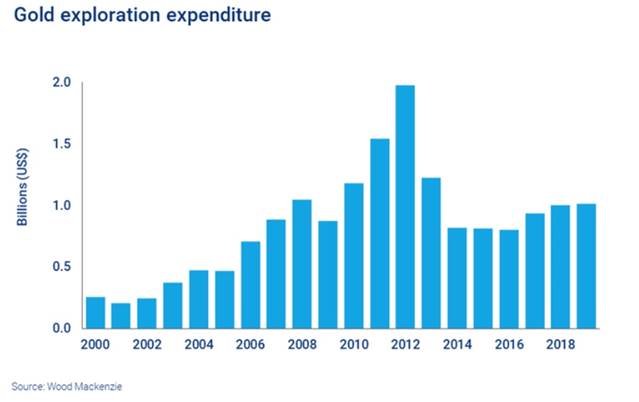
Exploration expenditures were slashed during the mining downturn that followed the top of the market in 2011 and 12, and have failed to recover. Although there has been a slight rebound in exploration spend in the past couple of years, capital has largely been deployed towards brownfield projects (past-producing mines) and near-mine development. It certainly hasn’t been enough to replenish mined ounces.
New deposits cost more to discover. This is because they are in far-flung or dangerous locations, in orebodies that are technically very challenging, such as deep underground veins or refractory ore, or so far off the beaten path as to require the building of new infrastructure from scratch, at great expense.
The costs of mining this gold are often too high. Only about one in three advanced-stage gold development projects ever become mines.
Without any prior knowledge or skill, picking the right gold junior, or any junior for that matter, to discover a deposit that becomes a mine, has needle and haystack odds; only 1 in 1,000 is successful. And only 10% of gold deposits contain enough gold to justify further exploration.
Citing these odds, the World Gold Council notes, Gold mine exploration is challenging and complex. It requires significant time, financial resources and expertise in many disciplines – e.g. geography, geology, chemistry and engineering.
Moreover, gold grades have been declining, meaning more ore has to be blasted, crushed, moved and processed, to get the same amount of gold as when the grades were higher, significantly adding to costs per tonne.
Then there’s the practice of high-grading where, instead of mining a deposit economically, by extracting, blending both low-grade and high-grade ore at a given strip ratio of waste rock to ore – the company “high-grades” the orebody by taking only the best ore, leaving the rest in the ground.
This practice cheapens the value of a deposit, in the long run.
900-tonne deficit
Back to peak gold, for years we’ve been predicting it. We were one of the first to say it, and now it’s coming true. But what does peak gold actually mean? AOTH did some detective work to find out.
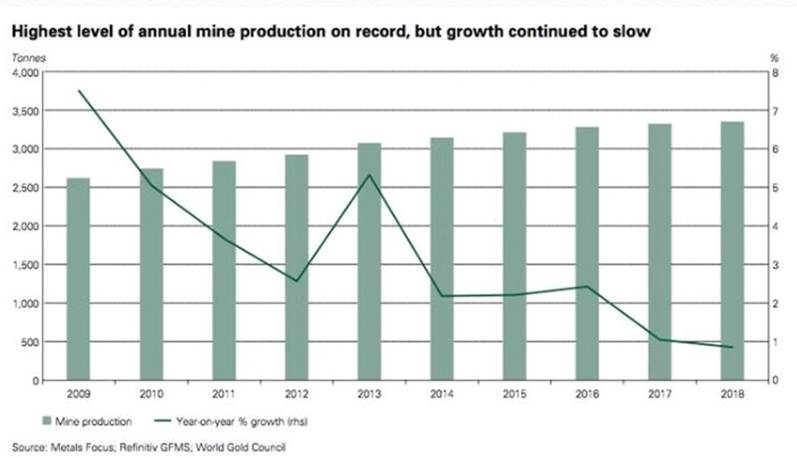
Conventional wisdom holds that peak gold is the point when the amount of gold supply hits a ceiling, then stops increasing. By this definition, gold has been increasing, year by year, although by smaller and smaller amounts – supporting the idea of the gold supply slowly building to a top.
So, while gold output in 2018 was higher than 2017, it was only 1% higher – 3,347 versus 3,318 tonnes, according to the World Gold Council. Gold production of 3,318t in 2017 was 1.3% more than 2016’s output of 3,274t. This phenomenon is shown graphically below.
But if we define peak gold as the point when mined supply no longer meets gold demand, the gold market peaked a long time ago. Allow me to explain.
Last year (2019) gold demand reached 4,355.7 tonnes.
WGC reports that 2019 mine production was 3,463.7t.
Gold jewelry recycling was 1,304t, bringing total gold supply last year to 4,776.1t.
If we stop there, we show a slight gold supply surplus of 420 tonnes. Peak gold debunked!
Not so fast, let’s think about those numbers for a minute. In calculating the true picture of gold demand versus supply, we, at Ahead of the Herd don’t, and won’t, count jewelry recycling. What we want to know, and all we really care about, is whether the annual mined supply of gold meets annual demand for gold. It doesn’t! When we strip jewelry recycling from the equation, we get an entirely different result. ie. 4,355 tonnes of demand minus 3,463 tonnes of production leaves a deficit of 892 tonnes.
This is significant, because it’s saying even though major gold miners are high-grading their reserves, mining all the best gold and leaving the rest, they still didn’t manage to satisfy global demand for the precious metal, not even close. Only by recycling 1,304 tonnes of gold jewelry could gold demand be satisfied.
Now the question becomes, how do we close that 900-tonne (for round numbers) gap?
Well one way might be for companies to consolidate. Through mergers and acquisitions (M&A), larger gold companies typically buy smaller ones to bulk up their depleting reserves base. But this doesn’t really add to the global supply of gold; it simply moves a portion of global reserves from one company to the other. To add to the supply, the merged entity would have to add ounces to its reserves, either by drilling, or adjusting cut-off grades at its mines.
The other way, by far the harder, longer route to adding supply, is to find new gold mines.
A 2019 report from S&P Global Intelligence forecasts that over the next decade, major discoveries will increase to about 363 million ounces. That’s 11,343 tons, or 1,134t per year – enough to meet our 900-tonne deficit. But here’s the kicker: Previous research by S&P found it took 20 years to advance a greenfield gold project to production. Say the first 1,134 tons of gold, of S&P’s projected 11,343t, is discovered this year. It will be 2040, at the earliest, before any new gold is poured, which doesn’t help with our current supply deficit, or our future supply deficit because of existing mines running out of ore, at all, does it?
We’re also doubtful that 1,134 tonnes predicted to be found in 2020, and every year for 10 years, is realistic.
Mine plans change, there may be strikes, or delays, plus a mine’s entire gold reserves are never completely mined out. Average mine life has dropped to about 12 years, so the operator has less time to mine and process all the gold promised in technical reports like the PEA. Not only that, the gulf between discovery and production has widened. It is estimated that, due to so many hurdles, only one-third of a company’s gold resources will ever reach the mill! It now takes 20, and in the future, possibly up to 30 years for a new mine to reach production. A lot can happen in 20 to 30 years.


Consider too, there will always be resource nationalism, no-go zones where gold mining is either too dangerous for gold companies to paint a target on their backs, or too risky to gamble shareholders’ equity. In November 2019, Quebec-based gold producer Semafo suspended its Boungou mine in Burkina Faso after a convoy of workers were attacked, leaving 39 people dead and dozens injured. Also in 2019, Progress Minerals’ executive Kirk Woodman was found dead in Burkina Faso after being kidnapped.
Rising inequality across much of the developed and developing world is also affecting gold supply, with impoverished populations far less willing to allow foreign companies to come in and mine their gold and other valuable minerals.
What about gold that was discovered 15, 20 years ago that is about to go into production this year, next year, and so on? S&P Intelligence has an answer for that question, too. Spoiler alert: it doesn’t correct our deficit. The research firm predicted a 2.3 million ounce (65-tonne) increase in 2019, with over half of that additional output coming from newly commissioned mines. That’s great, but it still didn’t come anywhere close to meeting last year’s gold mining deficit of 892t, without having to recycle jewelry.
This year, the coronavirus has made matters worse, with exploration projects halted and producing mines forced to cut output, due to government-imposed lockdowns, thereby increasing the gap between gold mine supply and gold demand.
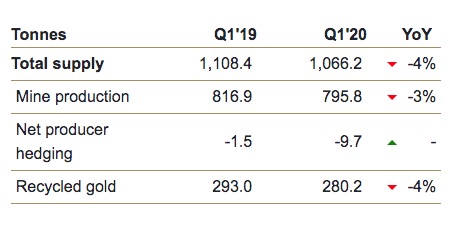
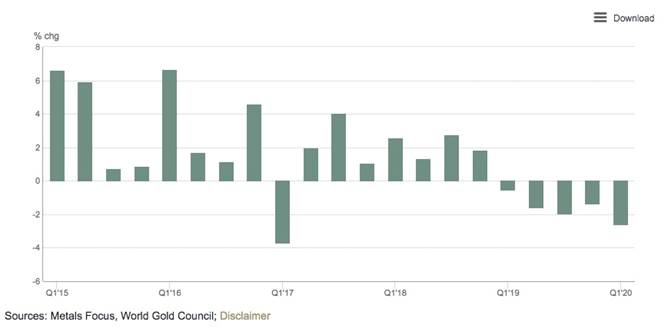
The latest World Gold Council report shows a 4% decline in total gold supply in the first quarter, compared to Q1 2019. That’s the biggest hit to quarterly gold supply in seven years. Mine production slid 3%, to a five-year low of 795.8 tonnes. In the graph below, notice the % change in mine production going negative in the first quarter of 2019 and staying negative for five consecutive quarters.
According to the World Gold Council, the world’s top gold producer, China, suffered a 12% year on year production decline in the first quarter. Peru lost 17% of its output, Argentina 13% and South Africa 11%. A May report by Resource Monitor states that Australia will overtake China as the number one gold producer in 2021, with gold miners there making high margins owing to lower costs of production and rising gold prices.
South Africa, once the epicenter of world gold production, has been eclipsed by Ghana, now the continent’s top bullion miner. Increasingly we are seeing Russian and Chinese production being bought up by their respective governments, further tightening the gold market.
WGC predicts 2020 gold output is “almost certain to suffer, especially given that the ramp-up of currently restricted operations to more normal levels will take some time.”
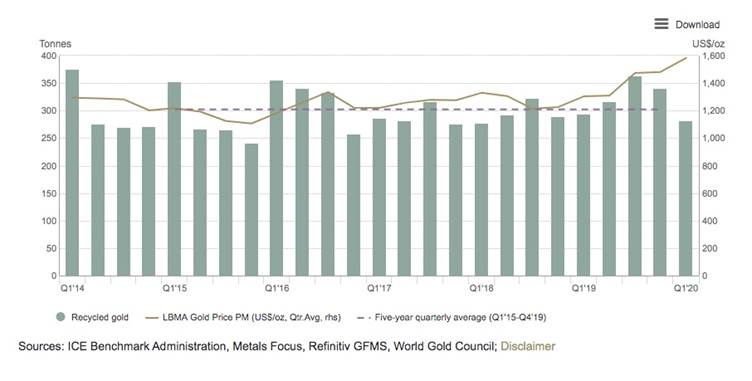
Jewelry recycling, upon which the gold industry relies in order to meet demand, was down 4% in the first quarter, despite gold prices rising steeply from around $1,500 an ounce in January to the current +$1,700/oz.
WGC says recycling activity slowed sharply amid lockdowns – with consumers confined to their homes and jewelry stores closed – and the fact that many would-be sellers hung onto their gold in expectations of higher prices. The first quarter’s 280.2t figure is 7% below the five-year quarterly average of 302.4 tonnes of recycled gold jewelry.
Indeed there is very little high-margin gold jewelry left out there. Most was sold during the 2011 run-up in gold prices to $1,900 an ounce, leaving only the “more expensive”, low-margin pieces purchased post-2011, when gold was between $1,200 and $1,700. It is likely many jewelry owners will want to wait for higher gold prices before selling these rings, bracelets and necklaces, putting further pressure on gold supply.
Put it all together, and you have a gold market in trouble, with so many pressures weighing on supply, including: a lack of new discoveries due in part to pared-down exploration budgets; M&A failing to increase supply, instead just concentrating it in larger companies; central banks continuing to accumulate gold and not selling it; the large gold-producing countries like China and South Africa outputting less; coronavirus-related gold mine shutdowns; falling gold grades; high-grading; the amount of time between discovery and production lengthening; and most importantly, the fact that mined gold supply has not, for a long time, met gold demand without recycling jewelry, which has also plummeted despite near-record prices.
Demand fueled by debt, stimulus
Moreover, the supply predictions we are quoting from in the S&P Global Intelligence report do not take into account the fact that gold demand might go up, and it probably will. That would mean having to find even more gold per year, maybe it’s more like 1,500 tonnes, or 2,000t.
The covid-19 pandemic, and the economic damage it has caused, is fueling huge safe-haven demand for gold. First-quarter inflows of gold ETFs saw the biggest rise in four years, amid global uncertainty and financial market turbulence, pushing global ETF holdings to a record high of 3,185 tonnes.
The high volatility of recent days shows just how closely North American stock markets are listening to, and responding to, news about the coronavirus.
Last week Texas and Florida – two of the first states to reopen – both hit daily highs of covid-19 cases, along with California. Infection rates in Arkansas, Alabama, North Carolina, South Carolina, Utah and Alaska also surged.
I’ve said all along that there would be a resurgence of covid in the United States. Re-openings there are a jumble, with each state doing its own thing and the federal government offering only guidelines not rules. A failure to adequately test and contact trace have made it worse. How do you stop the virus from spreading if you don’t know where it is and people are out and about not wearing masks and social distancing?
The latest US Labor Department report showed jobless claims are not falling at rates hoped for by Wall Street. More than 42 million Americans have filed for benefits since covid-19 shutdowns began in mid-March. Despite nation-wide attempts at reopening, the country could see a stunning 20% unemployment figure in May.
The US government and policymakers around the world have no choice but to unfurl massive stimulus programs to help their citizenries to deal with the worst recession since World War II.
The $2.2 trillion relief package Trump signed into law on March 27 is just the beginning, with the Treasury Department now seeking $250 billion more for small business loans. If House Democrats and the president can agree on a Phase 4 spending deal, targeting infrastructure, that would mean another $2 trillion.
Globally, up to 285 stimulus measures have been passed over the past eight months, including Japan, which approved a $1 trillion relief package in early April.
The World Gold Council states, “With the Fed taking interest rates to zero for the foreseeable future, gold could do well as it tends to outperform during easing cycles. Additionally, multi-trillion dollar fiscal stimulus policies to combat the economic impact of COVID-19 could prove inflationary – a development that could support gold prices in the long run.”
In a previous article we discussed the close relationship between gold and the debt to GDP ratio. Historically, we know that as the percentage of debt to GDP rises, so does gold. For a reminder of how this works, look at the FRED chart below.

The Commerce Department reported gross domestic product, the broadest measure of economic health, fell 5% in the first quarter, an even bigger decline than the 4.8% previously estimated. The Atlanta Fed projects economic growth during the second quarter to contract 41.9%!
That is the GDP side of the equation. On the debt side, covid crisis emergency stimulus measures include at a minimum, $2.2 trillion in new spending, and possibly doubling the Fed’s balance sheet to $10 trillion. As of May 20, the Federal Reserve balance sheet stood at a record $7.09 trillion.
Consider what a $10 trillion Fed balance sheet will do to the debt-to-GDP ratio. Consider what it will do to gold. Already at 106.5%, a level not seen since World War II, it’s not inconceivable for the ratio to spike to $150%, or 200%. That would mean for every dollar the US economy produces, it has to borrow $1.50, or $2.00. That’s insane.
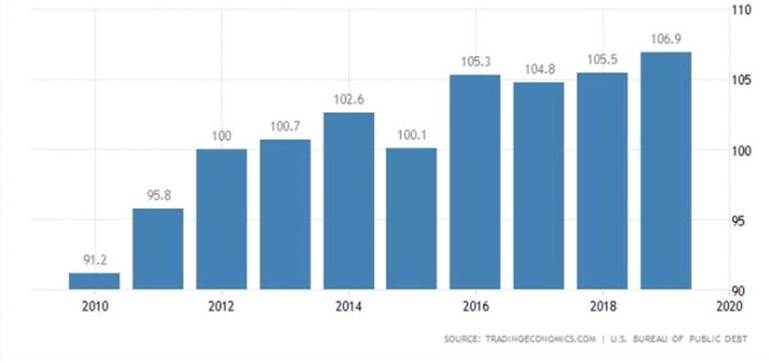
According to the World Bank, countries whose debt-to-GDP ratios are above 77% for long periods experience significant slowdowns in economic growth. Every percentage point above 77% knocks 1.7% off GDP, according to the study, via Investopedia.
In 2019 the global debt to GDP ratio hit an all-time record of 322%. The Institute of International Finance in January predicted that total global debt will exceed $257 trillion in 2020, and that was before the coronavirus.
We have more evidence of US debt levels getting out of control. According to Wolf Street, in the five weeks to June 8 the national debt spiked $1 trillion, to $26 trillion. The US government pays a billion dollars a day in interest to service this humongous pile of loans.
It certainly seems that the US Federal Reserve, and other central banks of countries struggling with the coronavirus, are locked into this spiral of stimulus spending of “Debt out the wazoo” leading to astronomical levels of borrowing leading to high debt to GDP ratios, resulting in higher gold prices.
Key to this conundrum is low interest rates, upon which all borrowing is based. Rates are expected to remain low for at least the next two years. On June 12 CNBC reported,
The Fed offered no additional policy tools to help guide the economy through what promises to be a murky road ahead, only assurances that short-term benchmark interest rates would remain anchored near zero through at least 2022.
If all of this stimulus we are seeing finally results in consumers spending again, say with the release of a vaccine, we are likely to see prices rise, big time. Inflation + low interest rates = higher gold.
The longer stimulus measures continue, and GDP growth falls, along with a creeping expansion of the Fed’s balance sheet and negative real interest rates (interest rates minus inflation) which are always bullish for gold, we see no reason to doubt that gold prices will keep climbing.
Junior gold picks
In the meantime, we believe now is an excellent time to be taking a position in one or two quality junior gold companies that have a decent shot at becoming a mine.
It’s interesting to read Wood Mackenzie, in its above-mentioned report, asserting that smaller projects (ie. gold juniors or small producers) are proving an exciting proposition for acquirers, since they can typically be brought online with speed and efficiency, particularly those with open-pit deposits or past-producing mines.
The most upside (and by far the greatest risk) comes from buying a junior when they are exploring and make an initial discovery. Great drill assay results can send a junior’s share price skyrocketing. The reverse can also be true. Junior explorers, the greenfield plays, are the riskiest plays by far. Strike out on assay results and it could be goodbye to a share price rise for a very long time – till the company finds another project they can work on. If you’re buying into this kind of play make sure the company has another fallback project in its portfolio.
At AOTH, we have assembled a portfolio of companies and projects that not only tick all our boxes in terms of risk vs reward, they also have an excellent chance at gaining the attention of larger mining companies.
These are companies owning assets with scalable, low cost production. Assets we think will make a difference to a major or mid-tier’s bottom line. They have projects that will be valuable to an acquirer looking to bolster its mineral reserves. Some of them may need a little proving out, but the upside is there, along with strong management teams with many years of experience taking development projects forward.
Richard (Rick) Mills
subscribe to my free newsletter
aheadoftheherd.com
Ahead of the Herd Twitter
Legal Notice / Disclaimer
Ahead of the Herd newsletter, aheadoftheherd.com, hereafter known as AOTH.
Please read the entire Disclaimer carefully before you use this website or read the newsletter. If you do not agree to all the AOTH/Richard Mills Disclaimer, do not access/read this website/newsletter/article, or any of its pages. By reading/using this AOTH/Richard Mills website/newsletter/article, and whether or not you actually read this Disclaimer, you are deemed to have accepted it.
Any AOTH/Richard Mills document is not, and should not be, construed as an offer to sell or the solicitation of an offer to purchase or subscribe for any investment.
AOTH/Richard Mills has based this document on information obtained from sources he believes to be reliable but which has not been independently verified. AOTH/Richard Mills makes no guarantee, representation or warranty and accepts no responsibility or liability as to its accuracy or completeness. Expressions of opinion are those of AOTH/Richard Mills only and are subject to change without notice. AOTH/Richard Mills assumes no warranty, liability or guarantee for the current relevance, correctness or completeness of any information provided within this Report and will not be held liable for the consequence of reliance upon any opinion or statement contained herein or any omission. Furthermore, AOTH/Richard Mills assumes no liability for any direct or indirect loss or damage or, in particular, for lost profit, which you may incur as a result of the use and existence of the information provided within this AOTH/Richard Mills Report.
AOTH/Richard Mills is not a registered broker/financial advisor and does not hold any licenses. These are solely personal thoughts and opinions about finance and/or investments – no information posted on this site is to be considered investment advice or a recommendation to do anything involving finance or money aside from performing your own due diligence and consulting with your personal registered broker/financial advisor. You agree that by reading AOTH/Richard Mills articles, you are acting at your OWN RISK. In no event should AOTH/Richard Mills liable for any direct or indirect trading losses caused by any information contained in AOTH/Richard Mills articles. Information in AOTH/Richard Mills articles is not an offer to sell or a solicitation of an offer to buy any security. AOTH/Richard Mills is not suggesting the transacting of any financial instruments but does suggest consulting your own registered broker/financial advisor with regards to any such transactions
Legal Notice / Disclaimer
Ahead of the Herd newsletter, aheadoftheherd.com, hereafter known as AOTH.Please read the entire Disclaimer carefully before you use this website or read the newsletter. If you do not agree to all the AOTH/Richard Mills Disclaimer, do not access/read this website/newsletter/article, or any of its pages. By reading/using this AOTH/Richard Mills website/newsletter/article, and whether you actually read this Disclaimer, you are deemed to have accepted it.


