Even after record year, renewables still far from a threat to fossil fuel’s energy dominance – Richard Mills
2023.06.29
With the significant resources we have committed to renewable energy, you’d have imagined that by now there’d be meaningful improvements to our energy-related carbon emissions.
Yet the latest industry data shows that is far from the truth, and the energy transition still has ways to go before mounting a challenge to our traditional, more-polluting energy sources.
According to the latest edition of the Statistical Review of World Energy, even a record growth in renewables last year did nothing to shift the dominant status of fossil fuels, which accounted for a vast majority (82%) of the energy supply!
The report, a benchmark for the industry, was published for the first time this week by the Energy Institute, a UK-based global industry body, in collaboration with consultancies KPMG and Kearny. Before them, BP had been authoring the report on an annual basis since the 1950s.
Below are some of the key energy consumption trends highlighted by the report, now in its 72nd edition:
Energy Consumption Trends
As shown in the 2023 EI Statistical Review, 2022 saw a 1% increase in total primary energy consumption, slowing from the previous year’s 5.5%, but energy demand was still around 3% above pre-Covid levels in 2019.
The increase in primary energy supply between 2019-2022 was largely driven by renewable energy sources (excluding hydro) and coal, with increased gas production also evident.
Energy consumption grew across every region apart from Europe. In non-OECD countries, primary energy consumption was driven largely by China, accounting for 72% of the increase between 2019-2022. Primary energy demand in OECD countries, however, was slightly down against 2019 levels.


Renewables’ (excluding hydroelectricity) share of primary energy consumption in 2022 reached 7.5%, an increase of nearly 1% over the previous year. Still, despite the growing renewables consumption, fossil fuel as a percentage of primary energy remained steady at 82%.
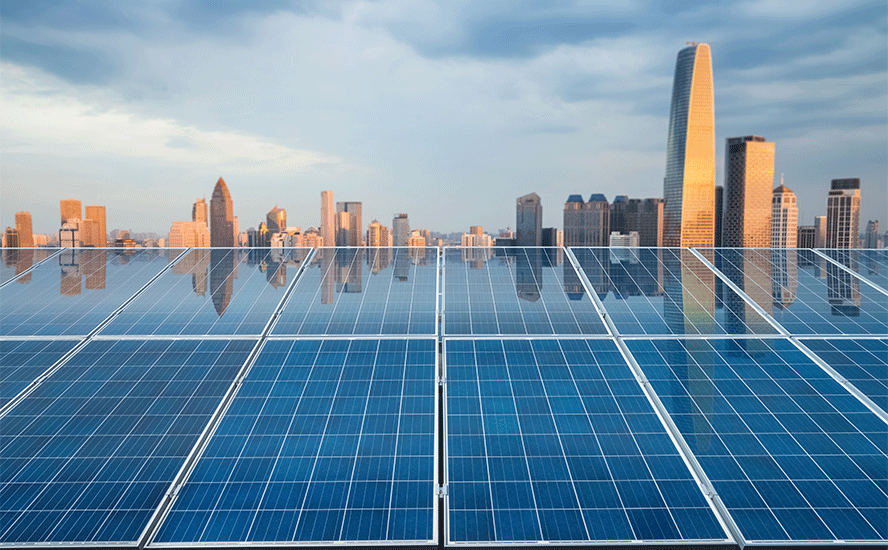
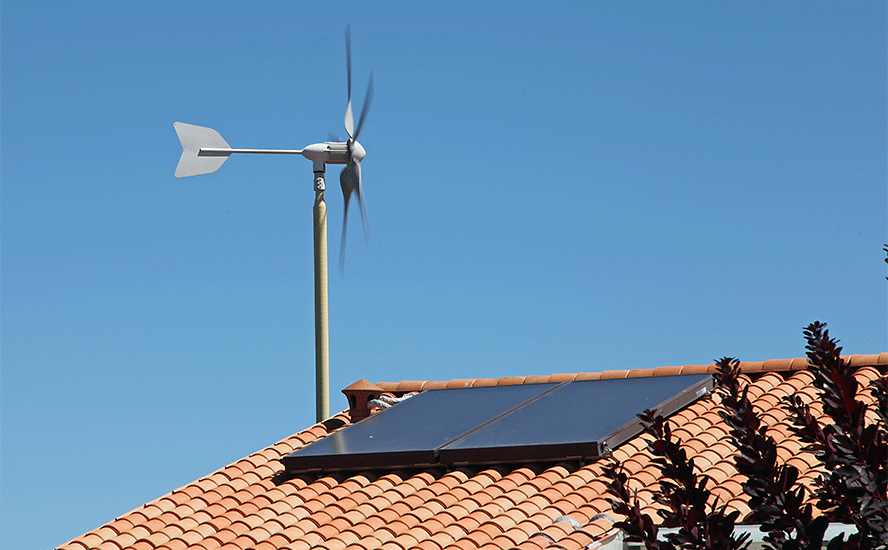
Electricity generation was up 2.3%, slowing down from the previous year’s 6.2%. Wind and solar reached a record high of 12% share of power generation, with the former recording a 25% growth in output and the latter at 13.5%.
Once again, the combined generation from wind and solar surpassed that of nuclear energy, which fell 4.4%.
Coal remained the dominant fuel for power generation in 2022, with a stable share around 35.4%, marginally down from 2021. Natural gas-fired power generation remained stable in 2022 with a share of around 23%.
In total, renewables (excluding hydroelectricity) met 84% of net electricity demand growth in 2022.
Note: non-fossil based electricity (nuclear, hydro, wind, solar, geothermal, biomass in power and other renewables sources) was calculated on an ‘input-equivalent’ basis – i.e. the equivalent amount of fossil fuel input required to generate that amount of electricity in a standard thermal power plant.
Renewables Growth
Growth in renewable power, excluding hydro, slowed down slightly to 14% versus last year’s 16%.
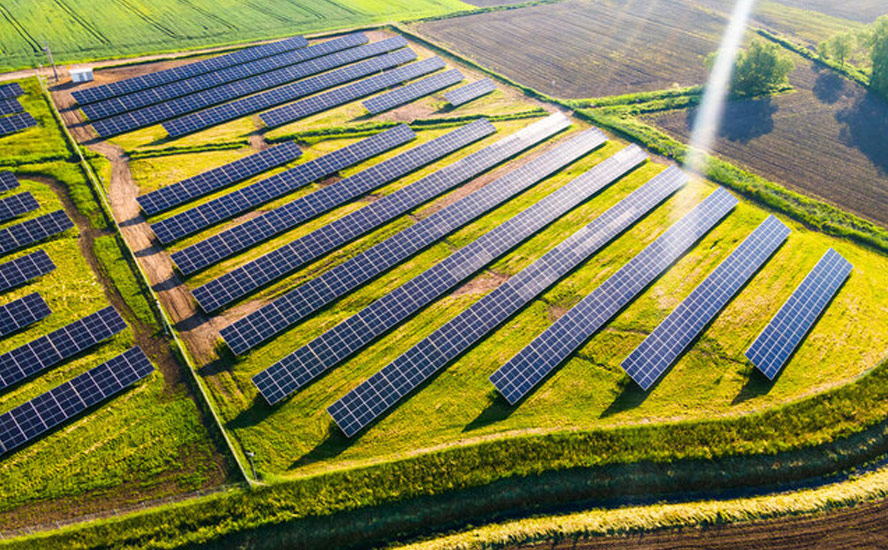
Despite the slowdown, solar and wind capacity still showed a record increase of 266 gigawatts, with solar taking the lion’s share at 72%. Of all nations, China added the most solar and wind power, accounting for about 37% and 41% of global capacity additions, respectively.
Hydroelectricity generation increased by 1.1% in 2022, whilst output from nuclear fell by 4.4%.
Fossil Fuel Dominance
The stubborn lead of oil, gas and coal products in covering most energy demand cemented itself in 2022 despite the largest-ever increase in renewables capacity at a combined 266 gigawatts, the EI Statistical Review found.
Oil
Oil consumption in 2022 increased by 2.9 million barrels per day (bpd) to 97.3 million bpd, with growth slowing compared with the previous year, but remained 0.7% below the 2019 levels. Most oil demand growth, the report says, came from a revived appetite for jet fuel and diesel-related products.
Global oil production increased by 3.8 million bpd in 2022, with OPEC+ accounting for more than 60% of the increase. Among all countries, Saudi Arabia and the US saw the largest increases, while Nigeria reported the largest decline in production.
Gas
Amid record prices in both Europe and Asia, global natural gas demand declined 3% in 2022, dropping just below the 4 Tcm mark achieved for the first time in 2021. Its share in primary energy also decreased slightly to 24% (from 25% in 2021). Gas production was stable year-on-year.
Liquefied natural gas (LNG) production was up 5% at 542 billion cubic metres (bcm), a similar pace to the previous year, with most growth coming from North America and the Asia-Pacific region. The increase in global LNG demand was triggered by Europe, which saw its imports rise 57%.
Coal
In 2022, coal consumption continued to rise, up 0.6% for the year, its highest level since 2014. This is despite coal prices hitting record levels, rising 145% in Europe and 45% in Japan.
The increase in coal consumption was driven mainly by China and India, whose combined growth was sufficient to offset declines in other regions like North America and Europe.
Global coal output was 7% higher than the previous year, with China, India and Indonesia accounting for 95% of the growth.
Carbon Emissions Rising
With fossil fuels maintaining their dominance, emissions from all categories — energy use, industrial processes flaring and methane — continued to rise, growing 0.8% in 2022 to a record high 39.3 billion tonnes of carbon dioxide equivalent.
As expected, energy use contributed to most of the emissions, rising 0.9% to 34.4 billion tonnes, representing 87% of the global total. In contrast, carbon dioxide emissions from flaring fell 3.8%, and emissions from methane and industrial processes dropped by 0.2%, the EI report showed.

The Asia-Pacific region continues to lead the world in carbon emissions, now accounting for nearly half of the global total. The other prominent emitters are North America and Europe.
Commodities Running Hot
High energy prices in 2022 should have deterred consumption (and, in turn, carbon emissions), but they didn’t.
Brent crude oil prices averaged $101/bbl in 2022, its highest level since 2013. Natural gas prices reached record levels, rising nearly threefold in Europe and doubling in the Asian LNG spot market. US Henry Hub prices rose over 50% to their highest annual level since 2008.
Coal prices reached record levels in 2022, with European prices averaging $294/tonne and the Japan CIF spot price averaging $225/tonne.

Two minerals — lithium and cobalt — were also highlighted by the Energy Institute as important cogs in the energy supply chain. Like fossil fuels, prices of these two key minerals also surged in 2022.
Lithium carbonate prices jumped 335%, while cobalt prices were up 24%, even with their production rising 21% for the year.
The Takeaways
The big takeaway from the latest Energy Institute report is probably the unflappable position oil, gas and coal still hold in the global energy economy.
Despite demand for gas falling and demand for renewables (excluding hydro) increasing by double digits, over 80% of our total energy consumed is still represented by these fossil fuels, contributing to record high carbon emissions.
Remember, this was even with the largest-ever increase in wind and solar new build capacity, together reaching a record 12% share of global power generation.
“Despite further strong growth in wind and solar in the power sector, overall global energy-related greenhouse gas emissions increased again,” Juliet Davenport OBE, president of the Energy Institute, stated.
As far as our climate goals are concerned, Davenport says “We are still heading in the opposite direction to that required by the Paris Agreement,” whose long-term temperature goal is to keep the rise in mean global temperature to well below 2 °C (3.6 °F) above pre-industrial levels, and preferably limit the increase to 1.5 °C (2.7 °F).
Scientists say the world needs to cut greenhouse gas emissions by around 43% by 2030 from 2019 levels to have any hope of meeting the international Paris Agreement goal of keeping warming well below the 2 °C target.
But, like the Energy Institute’s Davenport pretty much suggested, the chances of achieving that are next to none.
Another theme that emerged from the Energy Institute data was the continued return of transport fuel demand patterns in a post-Covid era, but with major variations across geographies and fuel types.

China was a major outlier in this regard, in particular in terms of jet fuel remaining significantly below its pre-2019 level due to its ‘zero Covid policy, the Institute says.
Also needed considering is the turbulent energy market created by the Ukraine conflict and curtailment of Russian supplies, which resulted in unprecedented shifts in global oil and gas trade flows. 2022 was marked by record international gas prices in Europe and Asia.
“The EI Statistical Review provides a high-level view of how our energy systems are adapting to escalating geopolitical and environmental crises,” Davenport, founder and former chief executive of UK renewable company Good Energy, stated on the EI website.
“2022 saw some of the worst ever impacts of climate change – the devastating floods affecting millions in Pakistan, the record heat events across Europe and North America – yet we have to look hard for positive news on the energy transition in this new data.”
“As the world emerged from the pandemic and its impact on demand, 2022 witnessed energy markets again in crisis, with the Ukraine conflict upending assumptions about supply around the world. That in turn precipitated a price crisis and profound cost-of-living pressures across many economies,” Nick Wayth, chief executive of the Energy Institute, added.
Simon Virley, vice chair and head of energy and natural resources at KPMG in the UK, also chimed in: “The EI Statistical Review is essential reading for policymakers around the world trying to balance the energy trilemma. All aspects of the trilemma were put under severe strain in 2022.
“Despite record growth in renewables, the share of world energy still coming from fossil fuels remains stubbornly stuck at 82%, which should act as a clarion call for governments to inject more urgency into the energy transition.”
The Verdict: More Minerals Needed
If anything, what the EI Statistical Review really does is pour a bucket of cold water on what many believe to be a ‘smooth transition’ towards renewable energy.
Yes, deployment of solar and wind power is advancing at a rapid pace, now at a record share of the world’s power generation, but in comparison to fossil fuels, renewables still represent a tiny part of our energy consumption (7.5% versus 82%!).
What the report also does is tell us much more minerals than anticipated are probably going to be needed to actually move the needle for renewables.
BloombergNEF previously estimated that getting to our net zero climate targets could require almost $10 trillion worth of metals between now and 2050, with annual demand peaking at close to $450 billion in the mid-2030s.

Likewise, the IMF says that the demand boom triggered by the energy transition could lead to more than a fourfold increase in the value of metals production, totalling $13 trillion over the next two decades for copper, nickel, lithium and cobalt.
In particular, battery metals cobalt and lithium will experience the greatest consumption growth, increasing by four-fold and seven-fold respectively by 2050, according to IMF forecasts. Nickel could even see demand rise close to ten times during this decade, Bloomberg estimates.
To meet the goals of the Paris Agreement, International Energy Agency data shows that sectors contributing to the green energy transition will be responsible for over 45% of the total copper demand, 61% of the nickel demand, 69% of the cobalt demand, and a whopping 92% of lithium demand by 2040.
This unprecedented level of consumption would eventually overwhelm our existing supply chain. Should production fail to catch up, sooner or later, the world could be facing a severe metals shortage that endangers a clean energy transition that is still gathering pace.
Conclusion
At this point, we can only conjecture that the share of renewables is only going to continue chipping away at fossil fuels’ dominance.
Kearney estimates that the global net capacity additions for renewables are expected to reach between 500 GW and almost 1,200 GW per year by 2030. For comparison, the entire global renewable capacity installed over the past decades stood at about 3,000 GW.
As we’ve seen last year, the commodity markets are pouring more fuel on the fire. Driven by price spikes, oil and gas companies are set to create almost $1 trillion in free cash flow in 2022. This windfall provides the capital needed to finance their own renewable ambitions, with some companies targeting more than 100 GW buildouts by 2030, Kearney says.
In addition, the US Inflation Reduction Act and Europe’s REPowerEU plan have set ambitious targets and provided hefty incentives, such as a tax credit of up to $3 per kg for low-carbon hydrogen, likely driving incremental capacity additions across low-carbon energy sources.
The question becomes whether supply can or will keep up. The answer, according to the authors of the Kearney report, is no in some cases.
For solar power, shortages in critical raw materials such as polysilicon are a risk, with available capacity only about 20% above current demand — rendering the supply chain vulnerable to unexpected factory shutdowns, says Kearney.
For batteries, concerns also loom on the raw materials side, with some forecasts estimating lithium shortages between 2024 and 2028. On the final product, it is estimated that production capacity will not meet supply in the short term, also driven by growing demand for electric vehicles.
Meanwhile, automakers are already reacting with vertical integration, a strategy that won’t be available to utilities. The wind turbine supply chain is also facing severe profitability troubles despite high demand.
Therefore, it’s hardly a guarantee that we’ll see global renewable energy capacity hitting new records every year given the supply constraint that beckons, and so fossil fuels would remain an integral part of power generation for some time.
With global carbon emissions reaching a new high in 2022, the Paris Agreement now seems like a pipe dream.
Richard (Rick) Mills
aheadoftheherd.com
Subscribe to my free newsletter
Legal Notice / Disclaimer
Ahead of the Herd newsletter, aheadoftheherd.com, hereafter known as AOTH.
Please read the entire Disclaimer carefully before you use this website or read the newsletter. If you do not agree to all the AOTH/Richard Mills Disclaimer, do not access/read this website/newsletter/article, or any of its pages. By reading/using this AOTH/Richard Mills website/newsletter/article, and whether you actually read this Disclaimer, you are deemed to have accepted it.
Any AOTH/Richard Mills document is not, and should not be, construed as an offer to sell or the solicitation of an offer to purchase or subscribe for any investment.
AOTH/Richard Mills has based this document on information obtained from sources he believes to be reliable, but which has not been independently verified.
AOTH/Richard Mills makes no guarantee, representation or warranty and accepts no responsibility or liability as to its accuracy or completeness.
Expressions of opinion are those of AOTH/Richard Mills only and are subject to change without notice.
AOTH/Richard Mills assumes no warranty, liability or guarantee for the current relevance, correctness or completeness of any information provided within this Report and will not be held liable for the consequence of reliance upon any opinion or statement contained herein or any omission.
Furthermore, AOTH/Richard Mills assumes no liability for any direct or indirect loss or damage for lost profit, which you may incur as a result of the use and existence of the information provided within this AOTH/Richard Mills Report.
You agree that by reading AOTH/Richard Mills articles, you are acting at your OWN RISK. In no event should AOTH/Richard Mills liable for any direct or indirect trading losses caused by any information contained in AOTH/Richard Mills articles. Information in AOTH/Richard Mills articles is not an offer to sell or a solicitation of an offer to buy any security. AOTH/Richard Mills is not suggesting the transacting of any financial instruments.
Our publications are not a recommendation to buy or sell a security – no information posted on this site is to be considered investment advice or a recommendation to do anything involving finance or money aside from performing your own due diligence and consulting with your personal registered broker/financial advisor.
AOTH/Richard Mills recommends that before investing in any securities, you consult with a professional financial planner or advisor, and that you should conduct a complete and independent investigation before investing in any security after prudent consideration of all pertinent risks. Ahead of the Herd is not a registered broker, dealer, analyst, or advisor. We hold no investment licenses and may not sell, offer to sell, or offer to buy any security.
Legal Notice / Disclaimer
Ahead of the Herd newsletter, aheadoftheherd.com, hereafter known as AOTH.Please read the entire Disclaimer carefully before you use this website or read the newsletter. If you do not agree to all the AOTH/Richard Mills Disclaimer, do not access/read this website/newsletter/article, or any of its pages. By reading/using this AOTH/Richard Mills website/newsletter/article, and whether you actually read this Disclaimer, you are deemed to have accepted it.


