Big Gold Breakout Nearing
- Home
- Articles
- Metals Precious Metals
- Big Gold Breakout Nearing
2022.01.07
Adam Hamilton, CPA
Gold is nearing a major technical breakout from a massive chart formation. This classic pennant is a type of continuation pattern, a long high consolidation which gold climbed into from below. Thus odds heavily favor this tightening pennant resolving to the upside, gold surging above upper resistance. That breakout will work wonders for battered gold sentiment, quickly reversing herd psychology from bearish back to bullish.
Technical analysis, or studying price-chart patterns, is something of a self-fulfilling prophecy. It works a lot of the time simply because enough traders believe it works. When a price breaks out from widely-watched technical lines, traders are quick to pile on to ride that momentum accelerating and amplifying it. Technically-oriented traders are more prevalent in some markets than others, and they utterly infest gold.
This leading alternative asset has two primary trading constituencies that drive its price action. Investors are the biggest and most-important, commanding vast pools of capital. They only migrate back into gold when it has enough upside momentum to attract them. As that has been sorely lacking lately, apathy has reigned among investors. When they aren’t interested, gold-futures speculators dominate gold’s price action.
While their capital firepower is far smaller than investors’, these specs trade with extreme leverage. Each gold-futures contract controls 100 ounces, worth $180,000 at $1,800 gold. Yet margin requirements this week only required traders to keep $6,500 cash in their accounts for each open contract. Thus the gold-futures speculators can run leverage as high as 27.7x! That dwarfs stock markets’ legal limit of 2.0x since 1974.
At 27.7x amplification of gold-price moves, these speculators can’t afford to be wrong for long. They face losing 100% of their capital risked if gold merely trends 3.6% against their bets! Those extreme risks force their trading time horizons into the ultra-short-term, days to weeks on the outside. As fundamentals usually don’t drive prices much over such myopic spans, gold-futures traders live and die by technical analysis.
So when investors are away so futures guys can play and dominate gold, it is one of the most-technically-oriented major markets in existence. And that extends to the entire precious-metals realm, since gold’s fortunes overwhelmingly drive silver and their miners’ stocks. So big gold breakouts quickly amplified by super-leveraged gold-futures trading are very impactful in precious-metals land. And the next one is imminent.
This chart looks at gold’s technicals over the past few years or so. Highlighted in red is gold’s colossal pennant formation, a triangular flag billowing out like at a renaissance festival. The flagpole initiating this classic pattern was formed by gold’s pair of massive 42.7% and 40.0% uplegs that crested in 2020. This high-consolidation pennant since is winding ever-tighter with its triangle point looming, which will force a breakout.
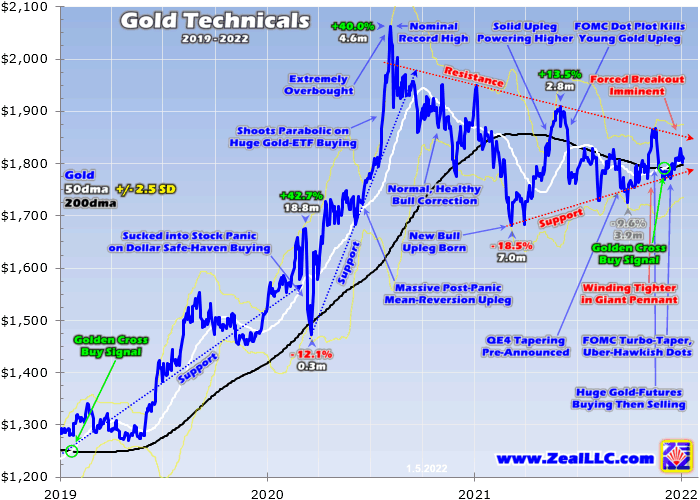
This huge pennant’s flagpole peaked at $2,062 gold in early August 2020. While that was a nominal all-time-record close, in real inflation-adjusted terms gold was relatively-much-lower. When adjusted by the intentionally-lowballed and heavily-flawed US Consumer Price Index, gold’s real apogee was $3,037 way back in January 1980. So the gold prices initiating this pattern weren’t extreme, just extraordinarily-overbought.
Gold shooting parabolic on colossal gold-exchange-traded-fund buying to form that flagpole necessitated a normal healthy bull correction to rebalance excessively-greedy sentiment. That grind lower in late 2020 and early 2021 started forming the upper resistance line of gold’s giant long-term pennant. Investors and speculators alike were digesting gold’s enormous gains following March 2020’s pandemic-lockdown stock panic.
Enough selling to push the herd-psychology pendulum back to fear finally accrued by early March 2021, extending gold’s correction to 18.5% over 7.0 months. Its double-bottoming on gold-futures speculators capitulating began defining this pennant’s lower support line. Gold has mostly stayed bound within this constricting triangular high-consolidation ever since, largely thanks to specs’ leveraged gold-futures trading.
That makes this pennant 17.0 months old, secular as far as chart formations go! After rallying into this big technical pattern from below, gold has consolidated high for the better part of a year-and-a-half. That has left gold running out of flag to meander sideways in, which guarantees a forced breakout sometime in the next few months. A type of continuation pattern, pennants usually resolve by continuing their entering trend.
That portends an imminent major upside breakout for gold, which gold-futures speculators will quickly pile into accelerating and amplifying that price move. That should fuel sufficient upside momentum to begin enticing indifferent investors back. Once they start migrating significant capital back into gold, it will be off to the races in this bull’s next major upleg. But this bullish outlook for gold is highly-contrarian these days.
That’s certainly understandable after gold’s weaker price action since last summer. Gold was powering higher in a solid young upleg after that last correction, up 13.5% over 2.8 months by early June. Then the FOMC threw a monkey wrench into the works, derailing that strengthening upward move. Top Fed officials started hinting at distant-future rate hikes, which unleashed extreme gold-futures selling slaying that upleg.
Several more bouts of heavy-to-extreme gold-futures selling erupted since, all fueled by Fed-tightening fears. These flared from economic data supporting more-hawkish monetary policies, statements from FOMC meetings, and comments by top Fed officials. I detailed and analyzed all these specific episodes in a mid-December essay on gold weathering this hawkish Fed. So if you aren’t up to speed, check that out.
For our purposes today, those periodic gold-futures pukings on Fed hawkishness wound gold ever-tighter in this massive pennant pattern. Between those episodes gold usually mean-reverted higher erasing much of those gold-futures-selling-driven losses. That ping-ponging around extended this pennant flag for another half-year or so, greatly solidifying it. Most of gold’s price action ground higher along lower support.
That happened again this week, after yet-another hawkish revelation from the FOMC. Back in mid-June, Fed officials’ individual unofficial rate-hike outlooks implied the first two hikes way out into year-end 2023. In late September the FOMC pre-announced the upcoming slowing of its epic fourth quantitative-easing money-printing campaign, which started in early November. Fed hawkishness skyrocketed again in mid-December.
At that last FOMC meeting, the QE4 taper’s pace was doubled enabling that process to end a few months earlier in March 2022. In addition to that turbo-taper, the dot-plot rate-hike expectations from Fed officials fully tripled from seeing two hikes total in 2022 and 2023 to six! And the minutes from that meeting just released this week included talk of actually starting to shrink the Fed’s grotesque QE-bloated balance sheet.
Since that quantitative-tightening runoff hadn’t been discussed yet as potential Fed tightening, that shook loose more leveraged gold-futures selling. With gold sentiment so bearish from those gold-futures-selling bouts, virtually no one believes gold’s turn to shine is returning. Thus this huge-pennant-nearing-upside-breakout thesis is almost heretical. But the FOMC’s coming monetary policies shouldn’t prove much of a threat.
Modern central bankers’ most-used strategy is simple jawboning, talking tough while actually doing very little! They are “all hat and no cattle” to borrow a great American idiom, describing people who act like cowboys but aren’t actual ranchers. While Fed officials are rightfully scared of the terrible inflation their out-of-control money printing has unleashed, they aren’t likely to have the courage to go beyond token actions.
Since March 2020’s stock panic fueled by pandemic-lockdown fears, this profligate Fed has ballooned its balance sheet an insane 110.6% or $4,599b higher! In just 22.1 months, this monetary base underlying the US-dollar supply has effectively more than doubled. That radically-unprecedented monetary deluge is why inflation is raging out of control, far more dollars are bidding up prices on relatively-less goods and services.
While the Fed’s new QE turbo-taper certainly caught traders’ attention, that acceleration of the slowing in QE4 money printing is immaterial. Before that, QE4’s total size was set to challenge $5.2t by June. Now it is on track to still exceed $5.0t by March. And merely slowing QE money printing leaves those many trillions of dollars of recently-conjured QE4 money in the system, which will keep forcing general prices higher.
Yes, the latest FOMC minutes just hinted at quantitative-tightening bond runoffs this week. But QT is just talk, far from the action stage. The last time the Fed tried QT to unwind QE, the resulting near-bear stock-market plunge panicked the FOMC to prematurely kill that bond runoff years ahead of schedule. That truncated QT unwound less than a quarter of the preceding QE! This Fed is big on talk but light on action.
Fed officials rightfully fear tightening driving major stock-market selloffs. Once those grow large enough, the Fed reverses course hard because it doesn’t want to risk spawning a negative-wealth-effect-induced recession or even depression. When stocks fall far enough for long enough, consumers feel poorer and pull in their horns on spending. That slows the entire economy, cutting into corporate profits forcing layoffs.
Thanks to that $5.0t of QE4 since October 2019, the US stock markets have levitated up to dangerous bubble valuations. That makes them even more susceptible to a major bear market than normal, which tend to ultimately slash stock prices in half. So the FOMC is super-unlikely to follow through on all of its hawkish talk, both on the QT and rate-hike side. Stock markets will tumble until the Fed Put’s strike price is found.
While Fed officials are hawkishly flexing on rate hikes, that jawboning is unlikely to actually be executed. The latest dot plot’s three federal-funds-rate hikes projected in 2022 followed by another three in 2023 are an all-hat-no-cattle type of thing. These outlooks are notoriously-inaccurate at predicting the FOMC’s later actions. The Fed chair himself warned about this after that mid-June FOMC meeting first implied rate hikes.
Jerome Powell said, “First of all, not for the first time about the dot plot. These are, of course, individual projections. They’re not a Committee forecast, they’re not a plan. … the dots are not a great forecaster of future rate moves. And that’s not because – it’s just because it’s so highly uncertain. There is no great forecaster of future [rates]. So, dots to be taken with a big grain of salt.” That’s straight from the horse’s mouth!
Examples are legion, even during the Fed’s last rate-hike cycle. As it launched in mid-December 2015, that dot plot forecast four rate hikes in 2016. But only a single one came to pass, fully one year later. The December-2018 dot plot coinciding with the FOMC’s ninth hike of that cycle predicted three more hikes in 2019 and 2020. Zero of those actually happened. Fed officials’ rate outlooks turn on a dime with stock fortunes.
But what if this cowardly FOMC actually musters the courage to grind out an entire rate-hike cycle? Gold tends to thrive in those historically. Since 1971 there have been twelve rate-hike cycles, this next one will be the modern era’s 13th. Gold averaged absolute gains of 26.1% across the exact spans of all dozen! In seven it rallied a huge average 54.7%, then in the other five it fell 13.9%. Two factors mostly governed this.
Gold performed the best during Fed-rate-hike cycles when it entered them relatively-low and they proved gradual, no more than one quarter-point hike per regularly-scheduled FOMC meeting. After consolidating high in its gigantic pennant, gold is far from overbought and very out of favor entering this next cycle. And there is no way this FOMC will risk hiking faster than once per meeting with these fragile bubble stock markets.
So while a long-Fed-delayed stock bear will almost certainly slay any actual QT or rate hikes well before they run their courses, even if they do gold tends to fare really well during tightenings. That’s mostly because they are so damaging to stock markets, eroding corporate profits which forces valuations even higher. That helps gold return to favor as the leading portfolio diversifier that usually rallies when stocks sell off.
Thus gold’s massive secular pennant is still likely to follow continuation-pattern precedent and break out to the upside in coming months. Fed officials have really been talking tough, but that is easy when stock markets are near record highs. They’ll change their tunes fast when these bubble markets roll over. And hawkish jawboning almost never plays out in proportional actions, these guys talk a big game before folding.
That’s even more true in a key election year, with November’s midterm elections critical for the future direction of the United States. Ruling political parties despise rate hikes because they weaken stock markets, and stock-market fortunes really affect Americans’ personal economic outlooks swaying their voting. So to avoid getting embroiled in political fighting, the FOMC will likely abstain from hiking after summer.
With that $5.0t of QE4 money printing more than doubling the monetary base staying in the system, gold prices are inevitably heading way higher to reflect that. The Fed’s balance sheet is now $8.8t, 2.2x higher than the $3.9t in the year before QE4 was born! Gold averaged $1,337 back then. To catch up with this wildly-unprecedented monetary deluge, it would have to soar up around $2,980 nearly regaining real highs.
The biggest beneficiaries of much-higher gold prices ahead are the fundamentally-superior mid-tier and junior gold stocks. They rallied sharply with gold into mid-November, but were dragged back down to their stop losses by another bout of heavy gold-futures selling. Our stoppings averaged out to neutral, fully recovering our capital. So we’ve been aggressively redeploying buying back in low in our newsletters.
If you regularly enjoy my essays, please support our hard work! For decades we’ve published popular weekly and monthly newsletters focused on contrarian speculation and investment. These essays wouldn’t exist without that revenue. Our newsletters draw on my vast experience, knowledge, wisdom, and ongoing research to explain what’s going on in the markets, why, and how to trade them with specific stocks.
That holistic integrated contrarian approach has proven very successful. All 1,247 newsletter stock trades realized since 2001 averaged outstanding +21.3% annualized gains! Today our trading books are full of great fundamentally-superior mid-tier and junior gold, silver, and bitcoin miners to ride their uplegs. Their recent realized gains into stoppings have run as high as +63.3%. Subscribe today and get smarter and richer!
The bottom line is a major gold breakout is nearing, with a massive pennant formation converging. Gold climbed into this big continuation pattern from below in powerful uplegs, and has been consolidating high ever since. Prices usually break out of big pennants in the same direction they entered, implying gold’s imminent breakout will be to the upside. That will ignite strong gold-futures momentum buying from specs.
The resulting acceleration and amplification of gold’s breakout rally will start enticing investors to return, fueling a major upleg. Fed tightening shouldn’t matter, as Fed officials talk tough but rarely follow through with all threatened actions. The FOMC surrenders after stock markets fall sufficiently on rate hikes and balance-sheet runoffs. And gold has tended to power strongly higher during past Fed-rate-hike cycles anyway.
Adam Hamilton, CPA
Legal Notice / Disclaimer
Ahead of the Herd newsletter, aheadoftheherd.com, hereafter known as AOTH.Please read the entire Disclaimer carefully before you use this website or read the newsletter. If you do not agree to all the AOTH/Richard Mills Disclaimer, do not access/read this website/newsletter/article, or any of its pages. By reading/using this AOTH/Richard Mills website/newsletter/article, and whether you actually read this Disclaimer, you are deemed to have accepted it.

