We the people

2020.03.25
$1,200. That’s the amount the US Congress is considering doling out to every American with a Social Security number, to see him or her through the coronavirus crisis.
In normal times that would be a nice chunk of change say, to pay off a credit card bill, put down a payment on a new vehicle, or book a trip to Florida.
As no-one needs reminding, these are far from normal times.
The one-shot payment is part of a colossal $2 trillion emergency aid package – the largest in US history – on which White House and Senate leaders struck a major deal on Wednesday morning – to help absorb the economic hit from covid-19.
As the crisis deepens, with the number of global cases topping 420,000, leaders and health officials are discouraging travel, telling people to restrict gatherings, remain in their homes and practice social distancing.
In many states, only businesses providing essential services are still open, including grocery and convenience stores, banks, doctor’s offices and pharmacies. They include California, New York and Ohio, which account for over 40% of US Gross Domestic Product.
Companies can no longer count on routine business to keep cash flows intact. Those that aren’t cutting staff are slashing shifts or reducing full-time workers to part-time. Most economists think the economy will shrink by at least 10% in the second quarter.
Yesterday James Bullard, the President of the St. Louis Federal Reserve Bank, said he sees the unemployment rate hitting 30% in coming months – worse than the Depression and three times as bad as the 2007-09 recession.
Stimulus promises
Amid all this, a bipartisan deal to bail out American companies and workers hangs in the balance, with both chambers of Congress still needing to pass it.
The new legislation, which looks like a souped-up version of the $700-billion financial crisis bailout, known formally as the Troubled Asset Relief Program (TARP) – minus the taxpayer-directed cash.
As we know from economic history, TARP failed miserably in its mandate to help small businesses and protect homeowners from foreclosure. As the big US banks and other large corporations, many complicit in the sub-prime mortgage debacle that incited the recession, received billions worth of federal aid, between 2018 and 2012, 4 million homes foreclosed.
Unless there are conditions attached to the current stimulus package, including that corporations can’t use the funds to buy back shares or issue shareholder dividends, rather the money has to go towards capital improvements and/ or protecting workers’ jobs, expect a re-run of TARP, only triple the magnitude, since this aid package is three times the size.
- the bill sets aside $250 billion for direct payments to individuals and families, $350B in small business loans, $250B in unemployment insurance benefits, and $500 billion in loans for distressed companies.
- The financial aid package will cut taxpayer checks for $1,200, for those earning up to $75,000 a year. Couples making up to $150,000 get $2,400, plus $500 per child.
- Negotiators discussed providing four months of unemployment benefits, including for self-employed workers.
- The package includes $500 billion in loans to struggling companies, including $50 billion for airlines. Democrats complained over the lack of oversight over how the money would be spent, so the Trump administration agreed to an oversight board and an inspector general position.
- Hard-hit hospitals will receive $140 billion, along with $150 billion for cash-strapped state and local governments.
We are pleased to see this plan differs from the 2008 bail-out package by containing more measures to directly target individuals, such as temporary debt payment relief and increased unemployment benefits, but we also note that $500 billion in loans are for “distressed” companies, the definition of which is subjective, including $50 billion to the airline industry which, we ought to remind readers, squandered the opportunity to prepare for the pandemic by spending $43.7 billion since 2012 on stock buybacks, which also enriched insiders who sold stock at an artificially inflated share price, pocketing enormous profits.
We also have to question whether help for individuals and small businesses goes far enough. Note the $350 billion is for loans, not grants to small business. ie. they have to pay it back.
The Wall Street Journal reports small businesses account for roughly half of US employment, yet they are among the most at risk. According to a 2016 study by the JP Morgan Chase Institute, the median small business had cash on hand that would last only 27 days. The median restaurant’s cash would tide them over for 16 days. 21% said they would fail after a month without cash flow, nearly a third couldn’t survive more than one to three months.
Meanwhile the average household is going deeper and deeper in debt – their confidence to spend fueled by continued low interest rates.
“Every day, several times a day, a thought comes over me / I owe more debts than I ever can pay back, more money than I’ll ever see.”
Lou Reed, The Debt I owe
Thirty-one percent of working adults say missing a paycheck would result in an inability to cover basic necessities. According to the Federal Reserve, household debt now stands at $16 trillion. Lower-income households have higher debt levels than before the financial crisis.
Instead of throwing $1200 or $1,500 at every American, how about tripling that to $5,000, instead of helping out companies like Boeing, which preferred to waste its profits on share repurchases rather than put it into additional safety measures that might have prevented the 737 MAX aircraft catastrophe? At least that would maybe cover three mortgage payments instead of just one. (Boeing, among other companies, is currently seeking $60B in loan guarantees from the government. Since 2012, the aircraft manufacturer has spent over $45B buying back its own shares. Fired CEO Dennis Muilenberg received a golden parachute of $80.7 million.)
Bailout redux?
It’s the lack of oversight in what is being proposed, that bothers one expert on corporate bailouts. Neil Barofsky oversaw the TARP rescue package in 2008. Quoted in the LA Times, he states, “If you’re going to distribute the money without conditions attached, at least incentives or penalties, your policy goals are not going to be achieved.”
In the case of the $500B bailout of distressed companies, as proposed, the goal is to preserve jobs. Excerpts from the article are revealing for how that objective could so easily be side-stepped:
[T]he proposal originally advanced by Senate Republicans would have weak or even nonexistent oversight, or mandates that companies spend the money on their workforce. Much of the cash would be disbursed at the discretion of Treasury Secretary Steven Mnuchin, with the recipients not even disclosed until six months after they’re funded.
The idea that we’re going to do this without transparency, without recipients being disclosed, and without any effective and strong and independent oversight mechanism,” Barofsky says, “is sheer madness, in my view.”
Even with legally binding oversight, the 2008 bailout failed to achieve its stated goals, which were to jump-start bank lending, especially to small business and home-buyers, and to protect homeowners from foreclosure.
Those promises were made by the bailout’s supporters to get the program through Congress, Barofsky recalls. But the money was disbursed without any conditions imposed to ensure that that happened.
As a result, the banks did everything but. To this day, Barofsky says, the published goals have not been met — “not even close”…
By 2010, then-Treasury Secretary Timothy Geithner was even acknowledging that the real, unstated goal of TARP had been not to avert foreclosures of distressed homeowners, but to enable the banks to handle the tide of coming foreclosures more efficiently. The program would “foam the runway” for the banks by stretching out foreclosures, giving the banks more time to absorb losses while … the bailouts juiced bank profits.”
The most disturbing case of deceit concerned the giant insurance company AIG, which had received a $170-billion bailout to keep it from collapsing, which experts feared could have precipitated a global financial meltdown.
Although the government bailout limited bonus payments to executives, AIG used a loophole to pay $168 million in “retention bonuses” to its executives, including those in the AIG division that had brought the company down…
“If your stated policy goal is around jobs, you can’t reasonably expect to put trillions of dollars of taxpayer money into a system and expect that result, if you’re not willing to take the step of putting those restrictions in place, or putting at least incentives in place, to accomplish those goals,” he says.
“Otherwise … you run a very significant risk that rather than preserve jobs, the money is going to flow right through the company and into the pockets of shareholders.”
Then there’s the repurposing of the TALF program, also deployed during the financial crisis. Under TALF, which stands for Term Asset-Backed Securities Lending Facility, the Fed lends money to an SPV [special purpose vehicle] which lends on a non-recourse basis to entities and well-connected individuals so that they can buy recently issued asset-backed securities (ABS) that they post as collateral, states a recent Wolf Street article:
[A]t the end of 2010, under orders from Congress, the Fed released 21,000 transactions it performed during the financial crisis, which revealed among many other outrageous acts, that the Fed lent to well-connected individuals and all kinds of hedge funds and others under its TALF program so that they would buy certain assets, such as these consumer loan ABS, drive up their prices, sell them to pension funds and others later for a huge profit, and pay back the loans to the Fed.
These well-connected individuals included John A. Paulson, Michael Dell, Christy K. Mack (wife of former Morgan Stanley CEO John Mack), Kendrick R. Wilson III (former Goldman executive and top aide to Hank Paulson Jr.), H. Wayne Huizenga (founder of AutoNation and Waste Management), Jonathan S. Sobel (head of Goldman’s mortgage department), etc. Some very wealthy people made a lot of money off the Fed’s bailout programs even as workers and the economy was in deep trouble…
Taxpayers eat the losses of SPVs. Under the TALF, PMCCF, SMCCF, MMLF, and CPFF, the Fed provides loans to SPVs. These SPVs then do the actual deals. If the assets they buy or take on as collateral default, they may produce losses for the SPV. To avoid transferring those losses to the Fed, the Treasury Department, via its Exchange Stabilization Fund (ESF), provides $10 billion in taxpayer money as equity capital to each SPV to start with. Once an SPV blows through $10 billion in losses, it just takes a technical adjustment for taxpayers to be on the hook for more.
Of course, nobody should be surprised by this. Nearly three-quarters of the current House of Representatives are highly-paid attorneys, business-people with white-collar jobs, or medical professionals, compared to say, Canadian parliamentarians who tend to be cut from more common cloth. These folks have little interest in protecting taxpayer dollars, much less working for Joe and Jill Sixpack, and every intention of passing laws that benefit their lobbyists, in return for contributions to their re-election campaigns.
It’s more evidence of the growing inequality we are seeing not only in America but throughout the world, as the carefully tended fruits of globalization show up more like spoilt goods.
Rising inequality
In the 1986 classic ‘Platoon’, Charlie Sheen’s character Chris tells everyone that he dropped out of college to serve in the Vietnam War. This sets him apart from the other grunts and makes Chris seem noble and patriotic, giving up school to go fight in a war. But his credo is soon shot down by a black soldier nick-named King, played by Keith David, who tells him:
“You got to be rich in the first place to think like that. Everybody know, the poor are always being f&$#8! over by the rich. Always have, always will.”
Today, King’s world-weary cynicism is just as relevant. The rich are getting richer, inequality is on the rise, and the middle class, which since the 1950s has been the backbone of the US economy, is shrinking.
In 2018 the three highest-paid chief executives in the United States earned more than the output of several countries. Tesla’s Elon Musk (#1 @ $513.3 million), Brendan Kennedy (#2 at $256M), the CEO of pot success story Tilray, and Bob Eger (#3 @ $146.6M), the boss of Walt Disney Co., made a combined $914 million, more than each of 11 countries that rank among the poorest in the world. Contrast this to the average Johny Paycheque.
“Through the mansions of fear, through the mansions of pain,
I see my daddy walking through them factory gates in the rain,
Factory takes his hearing, factory gives him life,
The working, the working, just the working life.”
Bruce Springsteen, Factory
In 2019 consumer debt in the United States hit $4 trillion for the first time. Total credit card debt surpassed $1 trillion, with the average American holding a balance of $4,923. A credit card survey quoted by CNBC says more than one third of Americans, 86 million people, are afraid they’ll max out their credit card when making a large purchase, which most considered to be anything over $100.
Canadians are also loading up on debt with vigor. Statistics Canada reported the average Canuck household was using a record 14.9% of its disposable income to meet debt obligations.
As incomes fail to keep up with spending, the difference financed by credit, the middle class is eroding – made worse by a drop in the number of middle-income jobs, through off-shoring and automation.
The share of adults living in middle-income households declined from 61% in 1971 to just 50% in 2015. Two-thirds of the 11% that were no longer middle class, migrated to upper-income levels, while a third became poorer.
And that gap continues to widen. The richest 400 Americans now control more wealth than the bottom 60% – it’s the greatest rich-poor divide since the 1920s.
A 2019 report by McKinsey Global Institute piles on more evidence of inequality getting worse. While the consulting firm notes the gap between developed and developing economies is shrinking, particularly with the rise of China and India, in many advanced economies, the trend is for the rich to pull away from the middling and the poor:
For example, in 2014, the wealthiest 1 percent of people in G-7 countries owned about 27 percent of the total wealth… In the OECD, wealth inequality has risen since 2000 on average in two-thirds of the member countries, as measured by the ratio of mean-to-median wealth
Economic disruptions and the widening of inequality over the past several decades have affected large segments of the population in G-7 countries. Wages have stagnated for many, male employment has declined, and the economy may have become more fragile, as market incomes increasingly fail to lift people out of poverty. Market incomes for households were flat or fell for around 70 percent of households in advanced economies in 2014 compared with similar households in 2005… At the same time, the cost of basic goods and services, such as education and healthcare, has risen faster than overall inflation.
A 2016 report by the OECD examining the effects of the Great Recession found that the poorest 10% were unable to recover from the blow dealt by the financial crisis. These people remain stuck in low-quality jobs, had more job insecurity and experienced higher long-term unemployment.
In contrast, the richest 10% rapidly bounced back, states the OECD report, via The Guardian: “By 2013/14, incomes at the bottom of the distribution were still well below pre-crisis levels while top and middle incomes had recovered much of the ground lost during the crisis.”
In the three years of the recession, 2017-10, the bottom 10% saw their incomes decline the most, 5.3%, while the top 10% only dropped 3.6% drop. From 2010-16, the incomes of the richest 10% grew an average 2.3 versus the poorest whose paycheques only increased by 1.1% – exacerbating inequality.
We only have to look at Chile to see this dynamic in action.
Thousands of people turned out last year to show their frustration not only with rising public transportation costs, but widening inequality and what some see as the government’s attack on the poor.
A state of emergency was declared and armed forces mobilized on the streets of Santiago for the first time in nearly 30 years. Chile, the world’s largest producer of copper and with the most lithium reserves, is considered among the most stable and business-friendly Latin American nations.
But many Chilean are poor. In fact Chile leads the OECD’s 30 wealthiest nations in inequality, followed by Mexico, Turkey and the US. The richest 1% of Chilean society earns one-third of the nation’s wealth. Half of the country’s workers earn less than 400,000 pesos per month (roughly US$550).
Marginal tax rates and income inequality
Yawning social divisions like these are actually starting to look a lot like the early 20th century in Britain and the United States.
Recall what was written earlier: The richest 400 Americans now control more wealth than the bottom 60% – the greatest rich-poor divide since the 1920s.
A 2003 study on inequality in the US, published in the Quarterly Journal of Economics, found that in 1913, about 18% of income went to the top 1%. A new income tax did little to put a cap on incomes, which continued to rise until 1916, when the top marginal tax rate was raised to 15%. Subsequent hikes over the next two years put the highest marginal tax rate at 73% in 1918, on incomes over $100,000.
Between 1916 and 1923 income inequality dropped, then rose again, coinciding with a reduction in top marginal tax rates, to reach a peak in 1928, when 1% possessed nearly 20% of all income.
Not surprisingly, incomes leveled off during the Great Depression. Although income inequality in the 1930s lessened, total income was decimated, leading to mass unemployment and hardship. Workers began pressing for reforms, and with President Roosevelt’s New Deal, workers were given greater bargaining power.
Well, he hands you a nickel
And he hands you a dime
And he asks you with a grin
If you are having a good time
Then he fines you every time you slam the door
I ain’t gonna work for Maggie’s brother no more
Bob Dylan, Maggie’s Farm
While unions represented only about 10% of the labor force in 1910, by 1945 they were 33%, staying above 24% until the early 1970s. Also by 1944, the top marginal tax rate had climbed to 94%, on those making more than $200,000 a year.
Income inequality fell considerably during the economic expansion of the 1950s. Between 1942 and 1952, the top 1% of income had dropped to below 10% of total income, stabilizing to around 8% for the next three decades – a period that economists have named the Great Compression.
However the shared prosperity of the post-War boom came to an end in the early 1970s, a decade saddled with low growth, unemployment and high inflation. The 16-month recession from 1973-75 was the longest since the Depression.
In the UK, the Labor government tried to control inflation by restricting public sector pay raises, setting up widespread strikes by trade unions demanding higher wages, culminating in the 1978-79 Winter of Discontent in Britain.
The result was another reduction in top marginal tax rates, in an attempt to direct more money towards private investment. At the same time, corporations and financial institutions were deregulated.
For the next three decades, union membership declined from around 24% in 1978 to just 11.3% in 2011. The waning power of the unions meant that while labor productivity since 1973 has doubled, median wages only increased by 4%. Over the past 30 years, the marginal tax rate fluctuated between 28% and 39.6%, where it sits currently.
Investopedia notes a correlation between high income inequality and the onset of both the Depression and the financial crisis:
In 1976, the richest 1% possessed just under 8% of total income but has increased since, reaching a peak of just over 18%—about 23.5% when capital gains are included—in 2007, on the eve of the onset of the Great Recession. These numbers are eerily close to those reached in 1928 that led to the crash that would usher in the Great Depression.
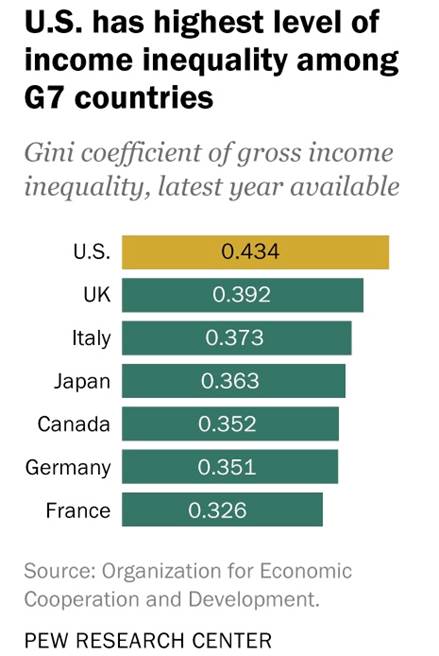
It’s also no surprise that income inequality has been a major theme of the current US presidential race, especially for the Democratic Party. The investor education website states: Near the end of 2013 the Economist published an article claiming that out of any highly developed nation in the world the U.S. had the highest after-tax and transfer level of income inequality, with a Gini coefficient of 0.42.
The Gini coefficient is often used as a gauge of economic inequality. From 2013 to 2018, the figure rose from 0.42 to 0.49. That year, households in the top fifth of earners, those with incomes about $130,000, pulled in 52% of all US income – greater than the lower four-fifths combined, according to Census Bureau data.
In 1968, the top 20% of income earners brought in just 43% of total US income, compared to 56% for the lower four quintiles.
Watch this video by CNBC to understand five key drivers of inequality that are widening the gap between the rich and the poor:
- The digital revolution, which creates huge opportunities for those with the skills and education to take advantage, but eliminates “middle skill” jobs like clerical and manufacturing positions that once produced middle-class incomes for those without college degrees;
- Globalization, involving competition from economies like China, combined with reduced trade barriers, have further reduced prospects for those without advanced skills. This was dramatically accelerated by China’s acceptance into the World Trade Organization in 2001. Around one in three American manufacturing jobs existent in 2000, were gone by the end of the Great Recession in 2010;
- Superstar tech firms like Apple, Amazon, Uber and Facebook are market disruptors that generate huge global revenues. Their CEOs, like Amazon’s Jeff Bezos, the richest man in the world, make obscene packets, dramatically accelerating the CEO-to-worker compensation ratio;
- The percentage of the workforce represented by labor unions has halved since the 1980s, shrinking their power to extract concessions from management. The government has not increased the minimum wage to keep pace with inflation.
- Certain government decisions have rewarded the wealthy, such as the $1.5 trillion Trump administration tax cuts in 2017, and college admissions procedures that open doors to their children above others;
Conclusion
Back to the coronavirus stimulus package, some commentators see it as another power grab by politicians and their corporate paymasters. New York City-based financial blogger Michael Krieger writes:
It didn’t take long for the most opportunistic, nefarious and corrupt actors in the U.S. to turn a pandemic crisis into another massive power grab attempt. We’ve seen it before; after 9/11 and also throughout the response to the financial crisis a decade ago. The irredeemable sociopaths who always make the big, important decisions used those crises to consolidate wealth and power. They’re going for it again.
Zero Hedge recently ran a blog piece titled ‘Divided, Distracted, Downtrodden: The Social and Political Reality in America Today’. Author W.J. Astore argues the American people are being kept “divided, distracted and downtrodden”, with class divisions constantly exploited to turn the middle class against the working poor.
Distractions come in the form of insatiable consumerism and the need to be entertained. The mainstream media is more interested in “gotcha” stories or celebrity gossip, driven by ratings and the need to sell products through advertising, than investing in meaningful journalism. Education is often of poor quality and various forms of debt – student, health care, mortgage – keep citizens enslaved to lenders:
Divided, distracted, and downtrodden: It’s a recipe for the end of democracy in America. But it also serves as a roadmap to recovery. To reinvigorate our democracy, we must fight against divisiveness, we must put distractions behind us, and we must organize to fight for the rights of the people, rights like a better education for all, less debt (a college education that’s largely free, better health care for everyone, and far less emphasis on consumerism as a sign of personal and societal health and wealth), and improved benefits for the workers of America, who form the backbone of our nation.
The way I see it, we are heading towards another reckoning in North America (inequality in Canada is also growing), regarding the gap between the rich and the poor. It was already a tinderbox waiting for a match; the spark that ignites it just might be the crisis we now find ourselves in, that some are predicting could be twice as bad as the Great Recession.
The politicians holding the purse strings are singing hymns from the same prayer book they used in 2008-09 – that is, get the consumer to spend, spend, spend, in order to get economic growth moving again.
But the consumer is holed up at home, the power to earn a living regulated by governments whose normal functions have been usurped by covid-19.
What they most want is for consumers to go back into debt, thereby filling the pockets of bankers, who hold the real power in America. Just look at the Federal Reserve – 100% of its shareholders are private banks; the stock is not publicly traded and none of its stock is owned by the US government.
The Federal Reserve Bank is a privately-owned company (Wikipedia describes the Fed as a “complex business-government partnership that rules the financial world”) that controls and profits immensely by printing money through the US Treasury and loaning money out to commercial banks.
The ability of the Fed to collect interest payments from commercial banks which are then divided among the Fed’s shareholders has left it open to criticism:
“[Most] people think the Federal Reserve Banks are U.S. government institutions. They are not … they are private credit monopolies which prey upon the people of the U.S. for the benefit of themselves and their foreign and domestic swindlers, and rich and predatory money lenders. The sack of the United States by the Fed is the greatest crime in history. Every effort has been made by the Fed to conceal its powers, but the truth is the Fed has usurped the government. It controls everything here and it controls all our foreign relations. It makes and breaks governments at will.” Congressional Record 12595-12603 — Louis T. McFadden, Chairman of the Committee on Banking and Currency (12 years) June 10, 1932
“… we conclude that the [Federal] Reserve Banks are not federal … but are independent, privately owned and locally controlled corporations … without day-to-day direction from the federal government.” 9th Circuit Court in Lewis vs. United States, 680 F. 2d 1239 June 24, 1982
When are people going to realize that the whole financial system rests on the ability of banks to make loans to average Joes and Janes who need to be kept as indentured wage slaves, Howard Winant’s Debt Peonage, for their corporate masters?
What happens when their 1200 bucks runs out, when their unemployment benefits are done, and people realize they have once again been duped by the corporations, funded by the banks, who have no intention of rehiring laid-off employees, when share buybacks and insider selling continues, revealing even worse inequality than before coronavirus?
You say you want a revolution? You just might get it.
Richard (Rick) Mills
subscribe to my free newsletter
aheadoftheherd.com
Ahead of the Herd Twitter
Legal Notice / Disclaimer
Ahead of the Herd newsletter, aheadoftheherd.com, hereafter known as AOTH.
Please read the entire Disclaimer carefully before you use this website or read the newsletter. If you do not agree to all the AOTH/Richard Mills Disclaimer, do not access/read this website/newsletter/article, or any of its pages. By reading/using this AOTH/Richard Mills website/newsletter/article, and whether or not you actually read this Disclaimer, you are deemed to have accepted it.
Any AOTH/Richard Mills document is not, and should not be, construed as an offer to sell or the solicitation of an offer to purchase or subscribe for any investment.
AOTH/Richard Mills has based this document on information obtained from sources he believes to be reliable but which has not been independently verified. AOTH/Richard Mills makes no guarantee, representation or warranty and accepts no responsibility or liability as to its accuracy or completeness. Expressions of opinion are those of AOTH/Richard Mills only and are subject to change without notice. AOTH/Richard Mills assumes no warranty, liability or guarantee for the current relevance, correctness or completeness of any information provided within this Report and will not be held liable for the consequence of reliance upon any opinion or statement contained herein or any omission. Furthermore, AOTH/Richard Mills assumes no liability for any direct or indirect loss or damage or, in particular, for lost profit, which you may incur as a result of the use and existence of the information provided within this AOTH/Richard Mills Report.
AOTH/Richard Mills is not a registered broker/financial advisor and does not hold any licenses. These are solely personal thoughts and opinions about finance and/or investments – no information posted on this site is to be considered investment advice or a recommendation to do anything involving finance or money aside from performing your own due diligence and consulting with your personal registered broker/financial advisor. You agree that by reading AOTH/Richard Mills articles, you are acting at your OWN RISK. In no event should AOTH/Richard Mills liable for any direct or indirect trading losses caused by any information contained in AOTH/Richard Mills articles. Information in AOTH/Richard Mills articles is not an offer to sell or a solicitation of an offer to buy any security. AOTH/Richard Mills is not suggesting the transacting of any financial instruments but does suggest consulting your own registered broker/financial advisor with regards to any such transactions
Legal Notice / Disclaimer
Ahead of the Herd newsletter, aheadoftheherd.com, hereafter known as AOTH.Please read the entire Disclaimer carefully before you use this website or read the newsletter. If you do not agree to all the AOTH/Richard Mills Disclaimer, do not access/read this website/newsletter/article, or any of its pages. By reading/using this AOTH/Richard Mills website/newsletter/article, and whether you actually read this Disclaimer, you are deemed to have accepted it.
