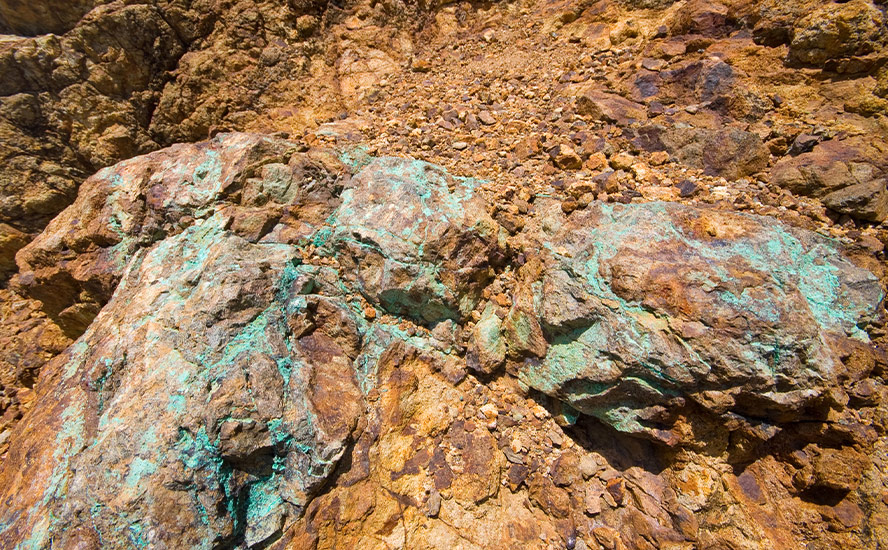
Silver is going up. Here’s one way to play it

2020.03.28
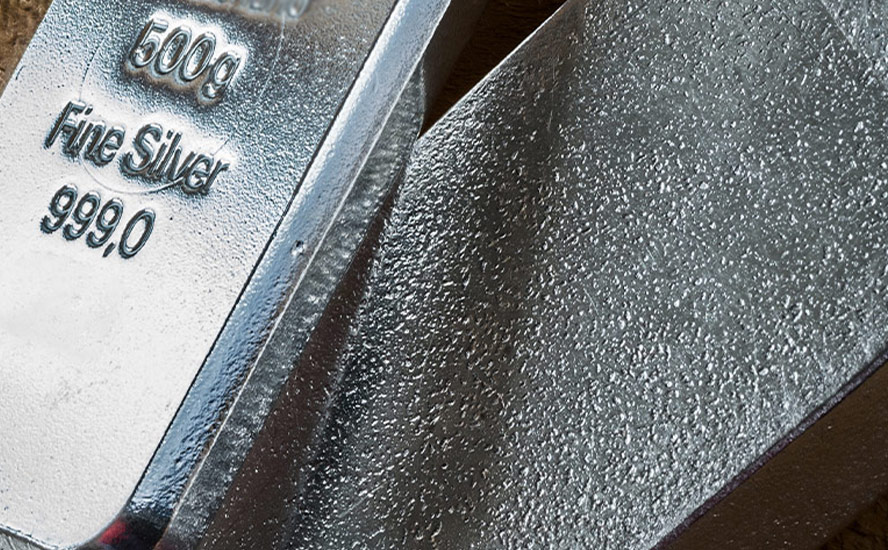
Silver has some of the same properties as gold, making it suitable for artwork, jewelry, and as a medium of exchange in silver coins and bars.
But unlike gold, silver has many more industrial applications – almost as many as oil. The precious metal is strong, malleable and conducts heat and electricity better than any other material.
Over 50% of silver demand comes from industrial uses like solar panels, electronics, the automotive industry and photographic applications. The solar power industry currently accounts for 13% of silver’s industrial demand. Around 20 grams of silver are required to build a solar panel.
The Silver Institute predicts 100 gigawatts of new solar facilities will be constructed per year between 2018 and 2022, more than double the world’s 2017 capacity of 398GW. A recent study by the University of Kent found that rising demand for solar panels is driving up silver prices.
While most of the mined gold is still around, either cast as jewelry, or smelted into bullion and stored for investment purposes, the same cannot be said for silver. It’s estimated around 60% of silver is utilized in industrial applications, leaving only 40% for investing.
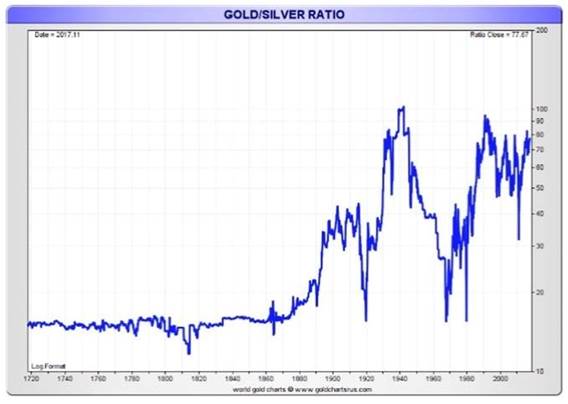
Gold and silver prices are often compared, to get a sense of which direction each are headed. The gold-silver ratio is the amount of silver one can buy with an ounce of gold. Simply divide the current gold price by the price of silver, to find the ratio.
On June 12, 2019, the gold-silver ratio hit a 26-year high by breaking through the 90-ounce mark – meaning it took over 90 ounces of silver to purchase one ounce of gold. (the ratio has subsequently moved beyond 110:1)The higher the number, the more undervalued silver is. Or to put it another way, the farther gold is pulling away from silver, in dollars per ounce.
Over time, this is exactly what has happened, as shown in the historical gold-silver ratio chart below.
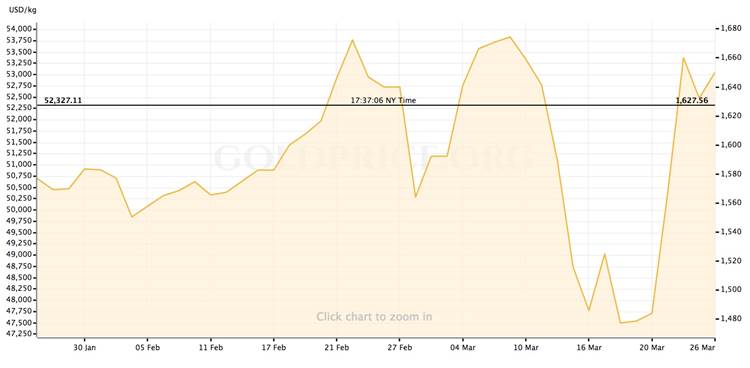
The onset of the coronavirus, first appearing as an epidemic in China, then spreading to Iran and South Korea, before becoming a full-blown pandemic in mid-March, has resulted in high volatility for both gold and silver.
Last week, the CBOE Gold ETF Volatility Index, a measure of price swings among gold ETFs, more than doubled in six trading sessions to the highest since November 2008.
We’ve seen gold spike on safe haven demand, as investors piled into gold ETFs, US Treasuries and the US dollar, only to fall sharply as traders sold their gold holdings to cover losses in other assets. In the past few days, gold has surged, reclaiming $1,600 per ounce on the back of a record $2 trillion stimulus package announced by the US government, to combat covid-19.
Spot gold finished Friday’s trading session at $1,628/oz, $143 higher, or +9.6%, than last Friday’s close.
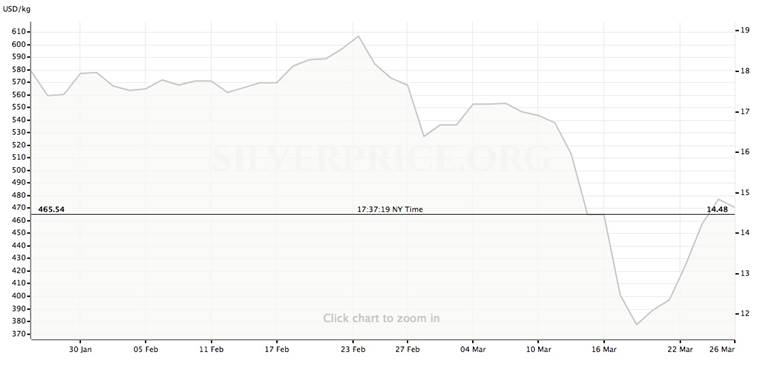
Silver also rose at the start of the outbreak, to within shouting distance of $19 an ounce, before falling below $15 as investors digested the negative effects the viral pandemic would have on industrial demand.
It skidded to $11.84 on Wednesday, March 18, then shot back above $14.00 over the next week, to finish Friday at $14.42/oz.
The current gold-silver ratio, a record 113:1, is double the historical ratio of 54:1, meaning silver is more than on sale, it’s being given away. As we wrote in Hi-yo Silver Away! silver is expected to do well in 2020 through a combination of higher industrial and investment demand, and tightened supply owing to mine production issues and output cuts.
Examples of the latter, due to government closures ordered to prevent the spread of covid-19, include:
- Bolivia’s largest mine, a huge deposit of zinc, lead and silver, has suspended operations;
- Pan American Silver, the world’s second-largest primary silver producer, has paused its mines in Peru and Argentina;
While demand for silver, like for most industrial metals, will fall during this current period of virus-related uncertainty, after the pandemic is beaten, we expect it to come roaring back.
Do you want to own the cheapest gold and silver you can find to reap the maximum coming rewards? If you do, buy it while it’s still in the ground.
Juniors, not majors, own the world’s future mines and juniors are the companies most adept at finding these mines. They already own, and endeavor to find more of, what the world’s larger mining companies need, to replace reserves and grow their asset bases.
In my opinion, one of the best ways to play silver right now, apart from selling physical gold to buy extremely undervalued physical silver, is to take a position in a company with a potentially large store of in-situ silver and copper resources.
That company is Max Resource (TSX-V:MXR).
Since November, Max’s geological teams and prospectors have been identifying copper and silver targets within a 120 km x 20 km area, at their Cesar copper+silver project in northeastern Colombia.
Max is using rock chip sampling to identify structures, continuity of thickness, and strike length, to determine potential size prior to drilling.
The Vancouver-based company is following the theory that continuous rock chip samples are pointing to a giant sediment-hosted copper+silver mineralized system.
In a Feb. 27 news release, Max notes that its recent AM North and AM South discoveries are hosted in well-bedded sandstone-siltstone similar to KGHM’s monster “Kupferschiefer” mines in Poland.
In an earlier interview with AOTH, Max’s head geologist, Piotr Lutynski, said Colombia’s stratigraphy is similar to his homeland, Poland, and its cluster of Kupferschiefer sediment-hosted copper-silver deposits.
“Kupferschiefer” copper shale
A classic Kupferschiefer consists of three main layers – sandstone, bituminous shale and limestone overlain by evaporates often containing oil and gas. Copper-containing fluids migrate up through the sandstone and get trapped by the carbon-rich copper shale. This is where most of the mineralization is concentrated, although it can also be found in the sandstone, limestone, or a combination of all three layers.
One of the best examples of Kupferschiefer sediment-hosted copper mineralization is a 60 km-wide by 20-km belt in Poland, which extends from Lubin in the southeast to Bytom Odrzański in the northwest.
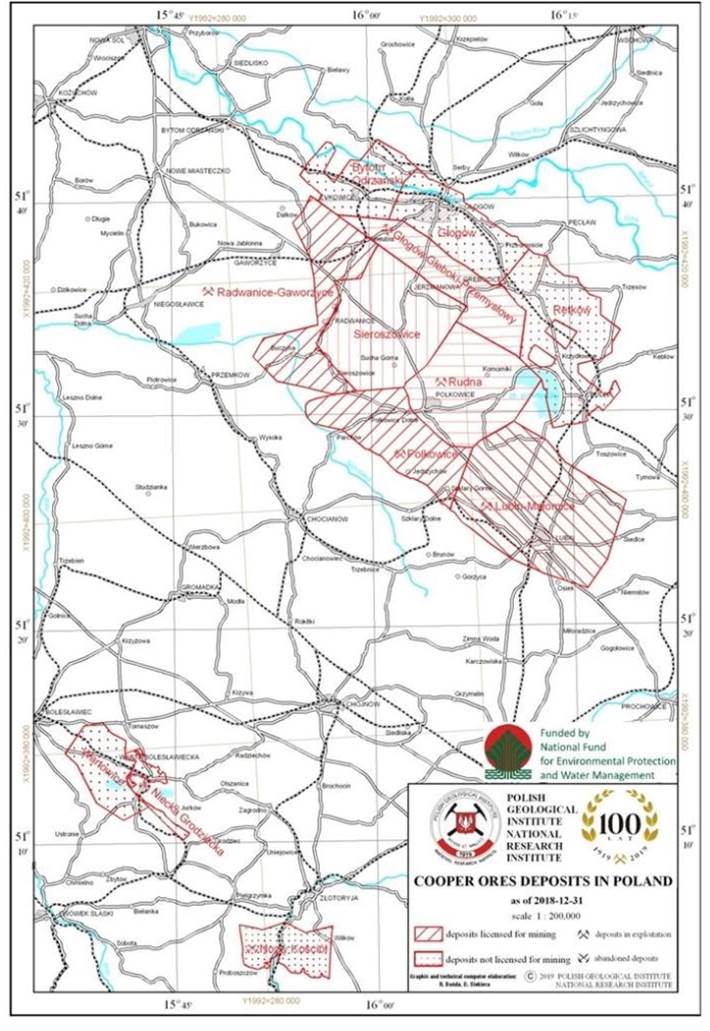
Kupferschiefer sediment-hosted copper deposits in Poland
The Kupferschiefer copper belt that underlies Germany and Poland is among only three “supergiant” sediment-hosted copper deposits in the world. It is also within an elite 1% of deposits that contain over 60 million tonnes of copper.
According to the Polish Geological Institute, Poland holds the largest economic copper resources in Europe, about 36 million tonnes, and the most anticipated economic silver resources on the continent, about 3.4 billion troy ounces.
Other metals recovered from copper ores at Poland’s Kupferschiefer deposits include gold, platinum, palladium and rhenium.
Despite being a small country, about the size of New Mexico, Poland produced 54,656,190 ounces of silver in 2019, up 18% from 2018, mainly as a co-product of copper mining.
State-run KGHM Polska Miedź (KGHM) is the third largest silver producer in the world, behind Fresnillo and Glencore, and the eighth biggest copper miner.
Its three underground mines in Poland – Lubin, Rudna and Polkowice-Sieroszowice – in 2014 produced 420,400 tonnes of copper and 44.3 million ounces of silver from Kupferschiefer ore, making it the fourth largest copper-mining operation on earth.
That same year, a project called “Deep Glogow” began mining from below the 1,200m level – accessed using infrastructure from the Rudna and Polkowice-Sieroszowice mines. The project contains 265.5 million tonnes grading 1.6% copper and 54 g/t silver, and has a mine life of 40 years.
In 2018 KGHM mined 30.252 million tonnes of ore at 1.49% copper and 48.6 g/t silver, comprising 452,000 tonnes of copper and 47.2 million ounces of silver.
According to the US Geological Survey, the massive volume of metal in Poland’s Kupferschiefer deposits is due to continuous mineralization that extends down dip and laterally for kilometers (Fig 3).
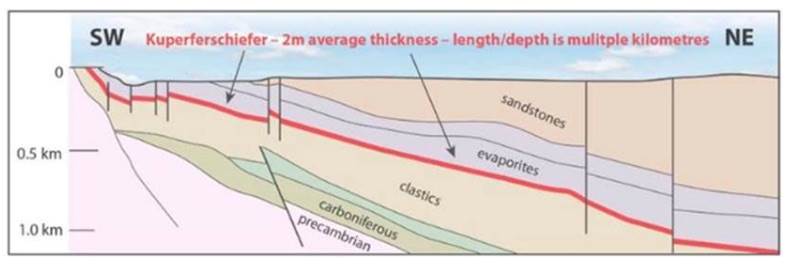
Continuous mineralization at Kupferschiefer
The strongest copper sulfide mineralization occurs in the black clay shales, including chalcocite, bornite, covelline and chalcopyrite, accompanied by minerals associated with silver, native silver, lead, zinc, cobalt and nickel.
Ore from the three underground mines – Lubin, Polkowice-Sieroszowice and Rudna – is extracted using the room and pillar method at depths of between 600 and 1,250 meters.
The giant Lubin-Sieroszowice deposit contains 52 million tonnes of copper and 2.275 billion ounces of silver, at an average thickness of 3.58m containing 1.99% Cu and 47 grams per tonne silver. These are high grades. In British Columbia’s copper-gold country, copper EQ grades average 0.4%.
Compare the close to 2% Cu to the grades being found at Cesar – up to 10.4% Cu and 88 g/t silver at the AM-1 discovery, and 24.8% Cu + 230 g/t silver at AM-2.
Of course, extreme caution is advised when comparing one project’s assays to another, but I consider Max’s results from AM North to be outstanding copper and silver grades. Also – these grades are averages from panels, not pieces of high-grade ore chipped from the outcrop to fool investors into thinking the whole outcrop is high-grade when only a small chunk of it is. It’s important for investors to differentiate between a select rock chip sample, and average grade across a 3m x 3m = 9 square meter panel.
This is an important distinction.
In the schematic below, notice the stratified nature of the Lubin deposit, with the black “Kupferschiefer” layer sandwiched in-between the multi-colored rock layers including sandstone and limestone. The black and white diagram at the upper right shows the U-shaped deposit characterized by columns of mineralization; each column consists of a thin layer of copper shale locked between the sandstone and the limestone, visualized here as a stack of books or a brick chimney.
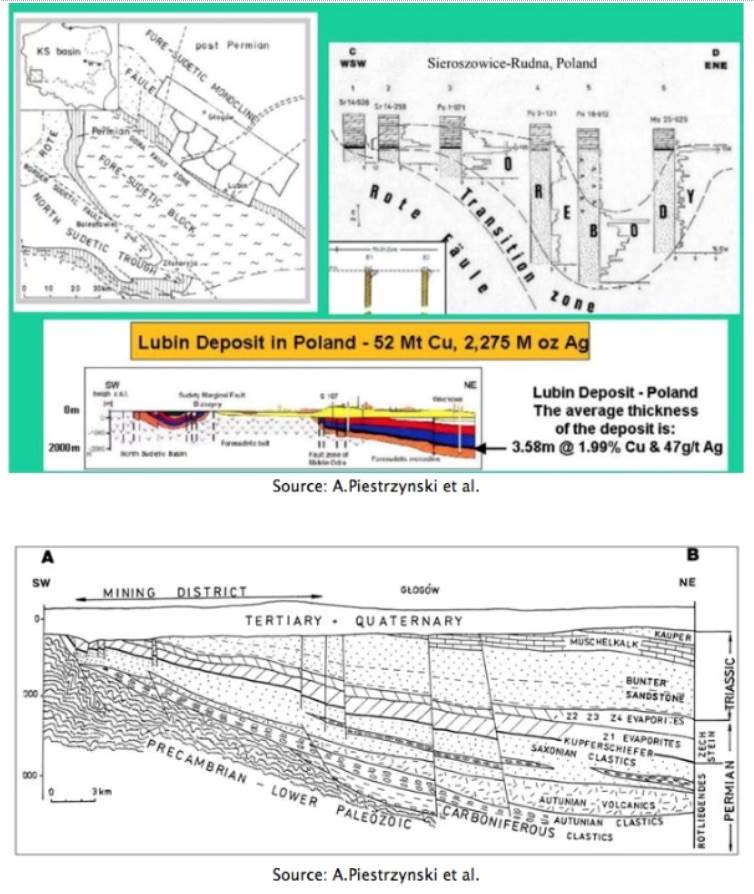
Lubin deposit in Poland
Outlining a porphyry copper deposit is difficult and expensive because so much drilling has to be done to figure out what is the size and shape of the deposit. With sedimentary copper, the trick is to find the copper outcroppings, then find the orebody that may be dipping beneath the soil cover. After that, it’s a matter of identifying the best drill targets.
Max’s goal is to get to that point, bring in a major copper company as a partner, that can help finance a drill program at Cesar and bring it to a resource, then complete the rest of the steps (PEA, prefeasibility study, feasibility study, permits, etc.) required to build a mine.
As smart resource investors, we recognize downtrodden sectors, and companies, and pounce on them when they go on sale. On the advice of the 18th century British banker, Baron Rothschild, “The time to buy is when there’s blood in the streets, even if it is your own.”
Currently there is high demand for physical silver, as investors worried about the future pick precious metals as a safe haven.
In Canada bullion dealers are having a hard time keeping silver and gold coins in stock, and in Australia, the Perth Mint, the country’s largest, is reportedly diverting production resources into the popular 1-ounce Silver Kangaroo coin to meet a backlog of orders.
Identifying who owns the most attractive silver, in the ground, that can be bought at historically low valuations would seem to me a very prudent investing strategy at the moment.
Look at the present 113:1 gold-silver ratio, it’s way past the record set last summer, in fact it’s double the historical average of 56:1. Because the investment market for silver is so small (60% is locked up in industrial uses) prices swing up and down wildly, at relatively low volumes.
We believe silver is going to correct, to the upside, and when it does, expect prices to move fast. There likely will not be much time to think about how to invest. We wouldn’t want you to miss out.
One way to catch silver’s expected wave in 2020, is to take a position in Max Resource (TSX-V:MXR). If the grades we are seeing through rock chip sampling at Cesar are indicative of anything close to a Poland-type Kupferschiefer deposit, you’ll definitely want to get in before the herd.
Max Resource Corp.
TSX-V:MXR
Cdn$0.08, 2020.03.27
Shares Outstanding 27,906,155m
Market cap Cdn$2,232,492m
MXR website
Richard (Rick) Mills
subscribe to my free newsletter
aheadoftheherd.com
Ahead of the Herd Twitter
Legal Notice / Disclaimer
Ahead of the Herd newsletter, aheadoftheherd.com, hereafter known as AOTH.
Please read the entire Disclaimer carefully before you use this website or read the newsletter. If you do not agree to all the AOTH/Richard Mills Disclaimer, do not access/read this website/newsletter/article, or any of its pages. By reading/using this AOTH/Richard Mills website/newsletter/article, and whether or not you actually read this Disclaimer, you are deemed to have accepted it.
Any AOTH/Richard Mills document is not, and should not be, construed as an offer to sell or the solicitation of an offer to purchase or subscribe for any investment.
AOTH/Richard Mills has based this document on information obtained from sources he believes to be reliable but which has not been independently verified. AOTH/Richard Mills makes no guarantee, representation or warranty and accepts no responsibility or liability as to its accuracy or completeness. Expressions of opinion are those of AOTH/Richard Mills only and are subject to change without notice. AOTH/Richard Mills assumes no warranty, liability or guarantee for the current relevance, correctness or completeness of any information provided within this Report and will not be held liable for the consequence of reliance upon any opinion or statement contained herein or any omission. Furthermore, AOTH/Richard Mills assumes no liability for any direct or indirect loss or damage or, in particular, for lost profit, which you may incur as a result of the use and existence of the information provided within this AOTH/Richard Mills Report.
AOTH/Richard Mills is not a registered broker/financial advisor and does not hold any licenses. These are solely personal thoughts and opinions about finance and/or investments – no information posted on this site is to be considered investment advice or a recommendation to do anything involving finance or money aside from performing your own due diligence and consulting with your personal registered broker/financial advisor. You agree that by reading AOTH/Richard Mills articles, you are acting at your OWN RISK. In no event should AOTH/Richard Mills liable for any direct or indirect trading losses caused by any information contained in AOTH/Richard Mills articles. Information in AOTH/Richard Mills articles is not an offer to sell or a solicitation of an offer to buy any security. AOTH/Richard Mills is not suggesting the transacting of any financial instruments but does suggest consulting your own registered broker/financial advisor with regards to any such transactions
Richard owns shares of Max Resources (TSX.V:MXR), MXR is an advertiser on his site aheadoftheherd.com
Legal Notice / Disclaimer
Ahead of the Herd newsletter, aheadoftheherd.com, hereafter known as AOTH.Please read the entire Disclaimer carefully before you use this website or read the newsletter. If you do not agree to all the AOTH/Richard Mills Disclaimer, do not access/read this website/newsletter/article, or any of its pages. By reading/using this AOTH/Richard Mills website/newsletter/article, and whether you actually read this Disclaimer, you are deemed to have accepted it.
