World’s major gold miners target copper porphyries

2019.11.08
Something has changed in the gold industry. During high gold-price periods the trend was to produce as much as possible – in many cases, irrespective of higher extraction costs per ounce. In a way you can’t blame them for making hay while the sun shone. The gold price rose for 12 consecutive years, hitting an all-time high of $1,907 an ounce in that heady summer of 2011. Why wouldn’t it continue?
Their lack of cost control came back to haunt the major gold miners when prices crashed in 2013, along with their market values.
Partying like it’s $1,900/oz
During the decade-long gold run (2001-11), gold giants like Newmont, Barrick, Goldcorp and Newcrest tried to out-mine each other with the annual ounce count being the main driver of shareholder returns and CEO bonuses.
According to McKinsey’s research, between 2000 and 2012, annual capital expenditures by gold mining companies increased 10-fold, with the aggregate spend exceeding $125 billion. Two thirds of projects exceeded budgets by 60%, and half experienced delays of one to three years.
As new mines started up and existing ones were outfitted with the latest equipment, reserves started to thin out. At the time, it was thought the best way to replace reserves, along with brownfield exploration (tapping existing or historic mines), was through mergers and acquisitions (M&A); between 1998 and 2012, 42% of gold companies’ reserves growth came via M&A.
From 2000 to 2010, the industry saw over 1,000 acquisitions with a combined value of $121 billion, versus just $27 billion from 1990 to 2000. It was an all out acquisition spree, growth at any cost, growth just for growth sake. Quality of the acquisition sometimes seemed to be of secondary importance.
The problem was all these acquisitions were done at the height of the gold market when nobody thought the hype could end. Examples included Goldcorp buying Canplats at a 41% premium to its share price, and Newcrest offering Lihir Gold shareholders the same percentage premium for an $8.5 billion acquisition.
Their sins would soon find them out. By 2012 the gold party was over.
For gold companies, there needed to be a major shift in their thinking. How could they remain profitable, having gorged themselves for 10 years on acquisitions and capital expenditures, conducting their business like it was a Roman orgy, but now working with a gold price that had almost been cut in half? The answer was aggressive cost-cutting and debt reduction.
Once bitten, twice shy
Today, the gold industry is leaner, meaner, and most would say, smarter. It’s a case of once bitten, twice shy. The industry went through a vicious four-year bear market before bullion’s value began turning a corner at the beginning of 2016. It does not wish for a repeat.
The current bull market – driven by a number of factors including central bank monetary easing, low interest rates, negative real bond yields, and heavy demand for gold ETFs – has seen a gold price above $1,500/oz for the better part of the third quarter, yet that has not converted to a significant boost in mined gold.
The World Gold Council’s third-quarter findings are telling: even with gold dancing above $1,500, global mine production was 1% lower in Q3 and flat year to date, at 877.8 tonnes and 2,583.4t (83.04 million ounces), respectively.
According to the WGC report, a major reason for gold production falling in the third quarter was Indonesia. The island(s) nation’s Grasberg mine (the second largest copper mine in the world with gold and silver credits) is exhausting its high-grade ore as it moves from a surface to an underground operation. The Batu Hijau mine has suffered output constraints too, as its open pit expansion reaches a seventh phase. All told, Indonesian gold production dropped a steep 41% in the third quarter, year on year.
Gold output in China, the number one producer, slid 4%, US production fell 1% due to lower output from Nevada mines including Cortez and Goldstrike, South African gold production decreased by 6% (in May, AngloGold Ashanti announced plans to sell Mponeng, its last remaining gold mine in South Africa), and Peru’s 12% reduction was due to falling ore grades.
Losses in these countries were tempered by gains in Australia and Ghana, the latter taking South Africa’s position last year as the continent’s top gold producer.
The amount of recycled gold gained 10% in the third quarter to 353.7 tonnes. On a quarterly basis (Q3 2019 vs Q3 2018), a higher percentage of gold is being recycled than mined (10% vs 1%). The industry seems to be taking a wait and see approach to gold prices, before cranking out the ounces. That’s not a bad thing.
Drilling deeper into the data, we see something similar happening with gold companies. A quick AOTH run through the latest quarterly reports of the Top 10 Gold Miners found that:
- Barrick nearly tripled its profit for the three months to September due to higher third-quarter output and gold prices. However, the Toronto-based gold behemoth also said it expects annual production guidance to stay the same through to 2024, at between 5.1 and 5.6 million ounces/year.
- South Africa’s AngloGold Ashanti expects 2019 production to be at the lower end of its forecast, due to a fall in Q3 output and rising costs.
- The recently merged Newmont Goldcorp expects annual production to fall by 0.2 million ounces, from 6.5 to 6.3Moz, on account of a blockade that has suspended operations at one of its largest mines in Mexico, Penasquito.
- Australia’s Newcrest Mining reported an 8% rise in its third-quarter (January to March) production, year on year, but that was 5% lower than the December 2018 quarter. It expects guidance to be in the 2.4 to 2.6Moz range.
This flat to lower-production trend may be just a lull, or it could be the beginning of peak gold.
Peak gold
The concept of “peak gold” should be familiar to most gold investors. Like peak oil, it refers to the point when gold production is no longer growing, as it has been, by 1.8% a year, for over 100 years.
Since the mid-2000s, six major gold miners have experienced declines in production. According to Bloomberg Intelligence data on the big producers, combined gold reserves shrank by almost half in 2018, to 406 million ounces, due to exploration budget cuts.
The 10 largest gold mines operating since 2009 will produce 54% of the gold as a decade ago – 226 tonnes versus 419 tonnes.
A Thomson Reuters report said 2016 was the first year since 2008 that gold mine output actually fell – by 22 tonnes or 3%.
While gold production has been increasing every year except for 2016, it’s been growing in smaller and smaller amounts. That is, while gold output in 2018 was higher than 2017, it was only 1% higher – 3,347 versus 3,318 tonnes, according to the World Gold Council. Gold production of 3,318t in 2017 was 1.3% more than 2016’s output of 3,274t.
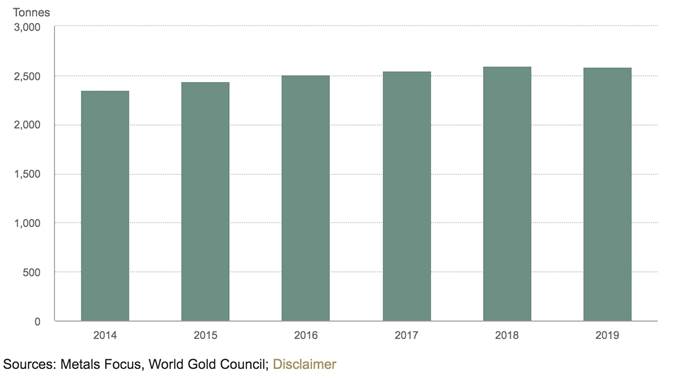
Answering the question, ‘Have we hit peak gold?’ means checking on some key statistics from the World Gold Council.
It’s a tricky question though. Conventional wisdom holds that peak gold is the point when the amount of gold supply hits a ceiling, then stops increasing. By this definition, gold has been increasing, year by year, although by smaller and smaller amounts – supporting the idea of the gold supply slowly building to a top.
But if we define peak gold as the point when mined supply no longer meets gold demand, the gold market peaked a long time ago. Allow me to explain.
Last year (2018) gold demand reached 4,345.1 tonnes.
WGC reports that 2018 was a record year for mined gold production – 3,347t.
Gold jewelry recycling was 1,173t, bringing total gold supply last year to 4,520t.
If we stop there, we show a slight gold supply surplus of 175 tonnes. Peak gold debunked!
Not so fast, let’s think about those numbers for a minute. In calculating the true picture of gold demand versus supply, we, at Ahead of the Herd don’t, and won’t, count jewelry recycling. What we want to know, and all we really care about, is whether the annual mined supply of gold meets annual demand for gold. It doesn’t! When we strip jewelry recycling from the equation, we get an entirely different result. ie. 4,345 tonnes of demand minus 3,347 tonnes of production leaves a deficit of 998 tonnes.
This is significant, because it’s saying even though major gold miners are high grading their reserves, mining all the best gold and leaving the rest, even hitting record gold production in 2018, they still didn’t manage to satisfy global demand for the precious metal, not even close. Only by recycling 1,173 tonnes of gold jewelry could gold demand be satisfied.
Where will 2019 gold production end up? It would be remarkable to see mined gold failing to reach 2018’s level, despite the spot price rising 16%, year to date.
Depleted reserves
If that happens, it will be because of depleted reserves, mostly (expansions restricting output and unexpected closures will play roles too) and a lack of new gold discoveries to replace them.
Mining is the story of assets that must be constantly replenished; miners that want to stay in business must replace every ounce taken out of the ground and there aren’t a lot of large gold deposits left to find or buy. Replacing what they’ve mined, let alone finding more, is getting harder and harder.
A 2018 report from S&P found that 20 major gold producers had to cut their remaining years of production by five years, from 20 to 15, based on falling reserves.
It’s not surprising that gold companies are finding it tougher to add to reserves. The fact is, all of the easy, low-hanging fruit has been picked.
According to McKinsey, in the 1970s, ‘80s and ‘90s, the gold industry found at least one +50 Moz gold deposit and at least ten +30 Moz deposits. However, since 2000, no deposits of this size have been found, and very few 15 Moz deposits.
Any new deposits will cost much more to discover. This is because they are in far-flung or dangerous locations, in orebodies that are technically very challenging, such as deep underground veins or refractory ore, or so far off the beaten path as to require the building of new infrastructure from scratch, at great expense.
The costs of mining this gold may simply be too high.
Moreover, gold grades have been declining since 2012, meaning more ore has to be blasted, crushed, moved and processed, to get the same amount of gold as when the grades were higher, significantly adding to costs per tonne.
Add to this the practice of high-grading where, instead of mining a deposit as it should be, economically, by extracting, blending both low-grade and high-grade ore at a given strip ratio of waste rock to ore – the company “high-grades” the orebody by taking only the best ore, leaving the rest in the ground.
The implication of high-grading is a dramatic improvement in a company’s margins, but at a huge loss of ounces to its reserve base, as well as lowering the deposit’s average grade, since all the best material has been removed.
Large mines where this has been occurring include Goldfields’ Granny Smith mine in Australia, Goldcorp’s Cerro Negro, Argentina, and Barrick’s Turquoise Ridge operation in Nevada.
M&A
One way for gold companies to increase their reserves is through mergers and acquisitions. This explains the Barrick-Newmont joint venture in Nevada, the fusing of Newmont and Goldcorp, and other recent examples of gold mining M&A.
Discovery
Besides M&A, the only other way to replace those precious gold ounces lost to extraction is through discovery.
A junior resource company’s place in the food chain is to acquire projects, make discoveries and hopefully advance them to the point when a larger mining company takes it over. Discoveries won’t be made if juniors aren’t out in the bush looking at rocks.
But junior mining financing has pretty much dried up. Between 2017 and 2018, bought-deal financings, whereby investment banks buy chunks of shares from juniors – have slumped 40%.
These days, gold juniors more than ever need the help of the majors to form partnerships with to develop new deposits – either through property acquisition, where the larger company buys the prospective mine; purchasing a stake in the junior; an earn-in agreement where the major agrees to pay for exploration; or through an outright acquisition.
The question then becomes, where does a major, perhaps working with a junior, go to find that elusive monster gold deposit? We know that when Barrick thought about adding ounces, it headed straight to Nevada.
Where else could they go? Because large pure gold deposits are so hard to find, gold miners are turning to deposits that contain other metals, like copper. At Ahead of the Herd, we think a very good strategy would be to look at copper porphyries, and especially, unexplored areas known to host porphyry deposits containing copper, gold, silver, molybdenum and other minerals.
Copper porphyries
According to a journal article, titled ‘Gold in porphyry copper deposits: its abundance and fate’, Porphyry copper deposits are among the largest reservoirs of gold in the upper crust and are important potential sources for gold in lower temperature epithermal deposits…
Gold is found in porphyry copper deposits in solid solution in Cu–Fe and Cu sulfides and as small grains of native gold, usually along boundaries of bornite… bornite and chalcopyrite can contain about 1000 ppm gold at typical porphyry copper formation temperatures of 600–700°C, and indicate that bornite and chalcopyrite in porphyry copper deposits were saturated with respect to gold at temperatures of only 200–300°C.
A porphyry deposit is formed when a block of molten-rock magma cools. The cooling leads to a separation of dissolved metals into distinct zones, resulting in rich deposits of copper, molybdenum, gold, tin, zinc and lead. A porphyry is defined as a large mass of mineralized igneous rock, consisting of large-grained crystals such as quartz and feldspar.
Porphyry deposits are usually low-grade but large and bulk mineable, making them attractive targets for mineral explorers. Porphyry orebodies typically contain between 0.4 and 1% copper, with smaller amounts of other metals such as gold, molybdenum and silver.
Most porphyry copper deposits occur close to subduction zones around the Ring of Fire – the horseshoe-shaped Pacific Ocean basin where regular and sometimes dangerous earthquakes and volcanic eruptions occur. The Ring of Fire stretches 40,000 kilometers from the southern tip of South America, up the North and South American coasts to the Aleutian Islands, down the East and Southeast coasts of Asia, and ending in a boomerang-shaped arc off the eastern coast of Australia.
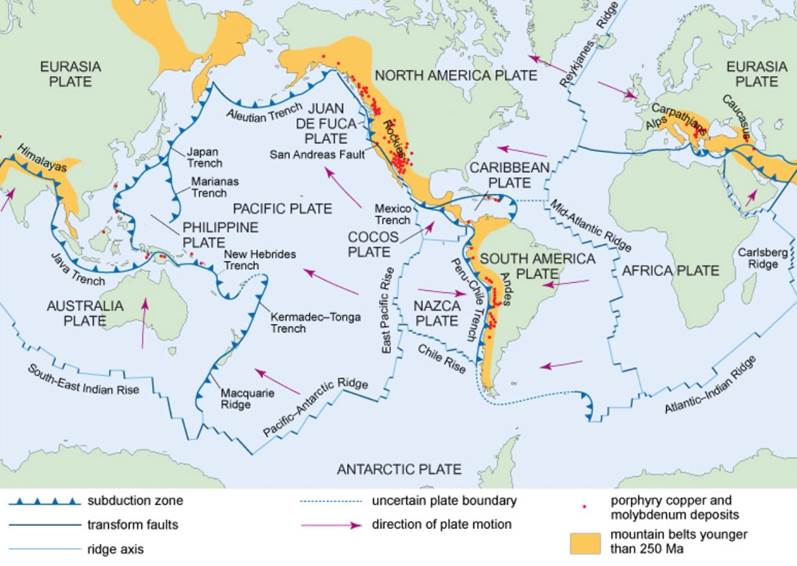
Copper porphyries were the first metallic deposits to be mined in open pits, starting in 1905 with the Bingham Canyon mine in Utah. Since 1970 over 95% of US copper production has come from porphyry deposits, and more than 60% of world annual copper production.
Among the largest copper porphyry mines are Chuquicamata (690 million tonnes grading 2.58% Cu), Escondida and El Salvador in Chile, Toquepala in Peru, Lavender Pit, Arizona and Malanjkhand, India, which has 145Mt at 1.35% Cu.
In Canada, British Columbia enjoys the lion’s share of porphyry copper/ gold mineralization. These deposits contain the largest resources of copper, significant molybdenum and 50% of the gold in the province. Examples include big copper-gold and copper-molybdenum porphyries, such as Red Chris and Highland Valley. Large, undeveloped porphyry deposits along the North American Ring of Fire include Galore Creek in BC and the Pebble project in Alaska.
There has been a definite trend by major mining companies towards making deals with junior resource companies that own copper/gold porphyry projects in BC. Historical examples include:
- Tiex/Newmont
- Novagold/Teck Resources
- Cariboo Rose/Gold Fields
- Terrane Metals/Goldcorp
- Kiska Metals (formerly Rimfire Metals)/Xstrata
- Serengeti/Freeport
- Strongbow/Xstrata
- Copper Mountain/Mitsubishi
At this year’s Roundup event in Vancouver, a presenter from Rio Tinto said that the second biggest mining company in the world wants to develop a porphyry in BC.
Barrick Gold is also reportedly looking to invest in copper assets as well as buying more top-tier gold projects in Canada and elsewhere to add to its portfolio.
Andean Copper Belt
One part of the world they should know about is the Andean Copper Belt. Running from Chile in the south, through Ecuador, up to Colombia and then northwest into Panama, the Andean Copper Belt hosts some huge copper-gold porphyry deposits including Escondida, the world’s largest copper mine.
This area’s geology is among the most richly mineralized in the world. During their evolution, the Andes mountains hosted a series of magmatic events that led to the formation of a number of large porphyry copper deposits, mostly in Peru and Chile.
Copper porphyry deposits with moly and gold kickers occur in Chile at Collahuasi-Quebrada Blanca, Chuquicamata, Escondida and El Salvador.
The Andean Copper Belt represents nearly half of the world’s copper production, but much of the Colombian part of this immense porphyry belt is hugely under-explored. While there is just one producing copper mine in Colombia, in the northwestern state of Choco, run by Canada’s Atico Mining producing 10,000 tons a year, the government is hoping to diversify from gold, oil and coal, into the red metal.
Recent geological studies found copper mineralization in not only Choco but Antioquia, Córdoba, Cesar, La Guajira and Nariño.
Colombia
Colombia has a large mining footprint. Before Brazil and Peru took over, it was the largest gold producer in South America, outputting close to 100 million ounces.
Recent tax reforms by the Colombian government secure a competitive edge for investors.
In December 2018, the new elected government introduced a new bill, known as the financing law. It proposes a gradual reduction in taxes on businesses from the current 35% to 30% by 2022, as well as a new sales tax refund of 19% for capital goods such as machinery. The financing law also repeals the 4% surcharge imposed on corporate income, making the total tax rate 33% for 2019, as opposed to 37%. These tax reforms bode well for mining companies, both to those in production and those in rapid development phase with heavy investments leading to production.
Conclusion
As global gold production flatlines, proven in the first part of this article, major gold mining companies will need to work harder and be creative in how they replace their dwindling reserves.
Copper porphyries can offer both size and profitability. They are one of the few deposit types containing gold, and often other metals, that have both the scale and the potential for decent economics that a major mining company can feel comfortable going after to replace and add to their gold reserves.
Not only that, a major gold mining company can mine the copper and get the gold “for free”, in that they’re already spending capital and production costs on copper extraction, the gold is just the icing on the cake. By mining copper, they’re producing gold too, which is a nice way for a gold major to pad its bottom line in an era when finding and mining gold for profit has become harder and more expensive to do.
The world’s major gold miners are starting to get desperate in their search for gold. If you are the CEO of a junior resource company with a copper/ gold porphyry in British Columbia, or Colombia, don’t be surprised by whose calling.
Richard (Rick) Mills
subscribe to my free newsletter
Ahead of the Herd Twitter
Legal Notice / Disclaimer
Ahead of the Herd newsletter, aheadoftheherd.com, hereafter known as AOTH.
Please read the entire Disclaimer carefully before you use this website or read the newsletter. If you do not agree to all the AOTH/Richard Mills Disclaimer, do not access/read this website/newsletter/article, or any of its pages. By reading/using this AOTH/Richard Mills website/newsletter/article, and whether or not you actually read this Disclaimer, you are deemed to have accepted it.
Any AOTH/Richard Mills document is not, and should not be, construed as an offer to sell or the solicitation of an offer to purchase or subscribe for any investment.
AOTH/Richard Mills has based this document on information obtained from sources he believes to be reliable but which has not been independently verified. AOTH/Richard Mills makes no guarantee, representation or warranty and accepts no responsibility or liability as to its accuracy or completeness. Expressions of opinion are those of AOTH/Richard Mills only and are subject to change without notice. AOTH/Richard Mills assumes no warranty, liability or guarantee for the current relevance, correctness or completeness of any information provided within this Report and will not be held liable for the consequence of reliance upon any opinion or statement contained herein or any omission. Furthermore, AOTH/Richard Mills assumes no liability for any direct or indirect loss or damage or, in particular, for lost profit, which you may incur as a result of the use and existence of the information provided within this AOTH/Richard Mills Report.
AOTH/Richard Mills is not a registered broker/financial advisor and does not hold any licenses. These are solely personal thoughts and opinions about finance and/or investments – no information posted on this site is to be considered investment advice or a recommendation to do anything involving finance or money aside from performing your own due diligence and consulting with your personal registered broker/financial advisor. You agree that by reading AOTH/Richard Mills articles, you are acting at your OWN RISK. In no event should AOTH/Richard Mills liable for any direct or indirect trading losses caused by any information contained in AOTH/Richard Mills articles. Information in AOTH/Richard Mills articles is not an offer to sell or a solicitation of an offer to buy any security. AOTH/Richard Mills is not suggesting the transacting of any financial instruments but does suggest consulting your own registered broker/financial advisor with regards to any such transactions.
Legal Notice / Disclaimer
Ahead of the Herd newsletter, aheadoftheherd.com, hereafter known as AOTH.Please read the entire Disclaimer carefully before you use this website or read the newsletter. If you do not agree to all the AOTH/Richard Mills Disclaimer, do not access/read this website/newsletter/article, or any of its pages. By reading/using this AOTH/Richard Mills website/newsletter/article, and whether you actually read this Disclaimer, you are deemed to have accepted it.
