Silver continues to gain in tight market

2019.09.17
Gold and silver prices jumped Monday on fresh safe-haven demand following a 10-drone strike on Saturday that took out two major oil facilities in Saudi Arabia. Iran-backed Houthi rebels in Yemen claimed responsibility, but the US government said Iran was behind it. Iran rejects the accusation.

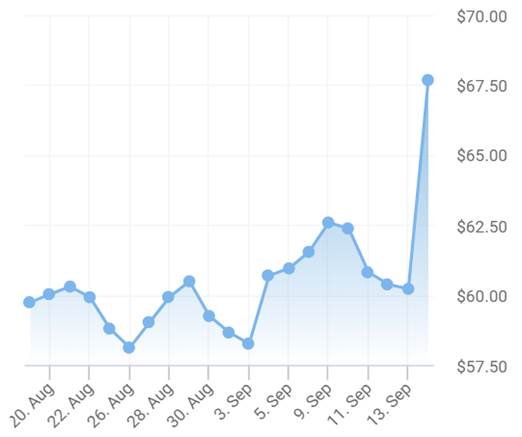
The attacks, which destroyed about 5.7 million barrels a day, equivalent to 5% of world oil supplies, immediately spiked oil prices. Brent crude ran up by 19%, the most daily gain the commodity has ever posted, Monday. One of the bombed facilities, Al Abqaiq, is the world’s most important oil processing plant.
The Saudis are the world’s largest exporters of crude, a significant percentage of which is still shipped to the United States, despite huge production gains from shale oil fields (Saudi Arabia is the second-most important US oil supplier, behind only Canada. The kingdom shipped 876,000 bopd to the US in July)
Oil markets haven’t seen this scale of a disruption since Iraqi forces invaded Kuwait in 1990. For now the Saudis are drawing from stockpiles to make up for the lost output. US President Trump also reportedly ordered the release of oil from emergency reserves.
At one point on Monday, Brent crude rocketed to US$71.95 a barrel on ICE Futures Europe, the biggest one-day percentage increase since 1991. As of time of writing, Brent crude and WTI were both trading 14% higher, at a respective $68.95 and $62.85 per barrel.
It’s unclear how long repairs at Al Abqaiq will take; the full impact of the incident will depend on how long Saudi Arabia takes to restore production. Trump hinted the United States may take military action, saying they are “locked and loaded depending on verification” of the culprit. Saudi Arabia is a key US ally.
The attack took investors by surprise and many took the opportunity to park their investments in safe havens like gold, silver and US Treasuries.
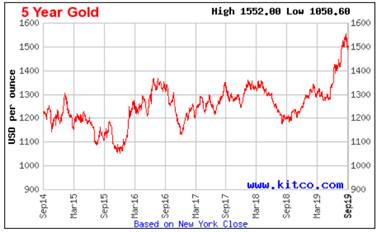
As of 3 pm EST, spot gold was at $1,501 an ounce, nearly $14 higher than Friday’s close of $1,487.90. Silver was up marginally, to $17.89 an ounce, compared to Friday’s $17.41 close.
In fact, gold and silver have advanced steadily since June, when the US Federal Reserve took additional interest rate hikes off the table and instead cut them by a quarter-percentage point. The Fed and other central banks’ dovish stances, along with falling currencies and an eye-popping $17 trillion in negative-yielding sovereign debt, globally, have sparked a rally in precious metals, which are seen by investors as a safe haven in times of economic turbulence and low bond yields.
Gold’s rise is also closely correlated to Trump’s tweets regarding setbacks in the now 18-month-old trade war between the US and China.
Year to date, bullion has slightly outperformed silver, by 17.5% versus 16%.
In this article we take a deep dive into silver, to see what’s moving the market.
How much silver is in the world?
The rarity of both precious metals becomes apparent when we consider how little gold and silver have been mined throughout history – just 190,000 tonnes of gold and 1.6 million tonnes of silver. Or in ounce terms, 6.1 billion oz of gold and 51.3 billion oz of silver. All the gold ever mined in the world could fit into a cube 21.6 meters on each side, and all the above-ground silver could fit into a 52m cube.
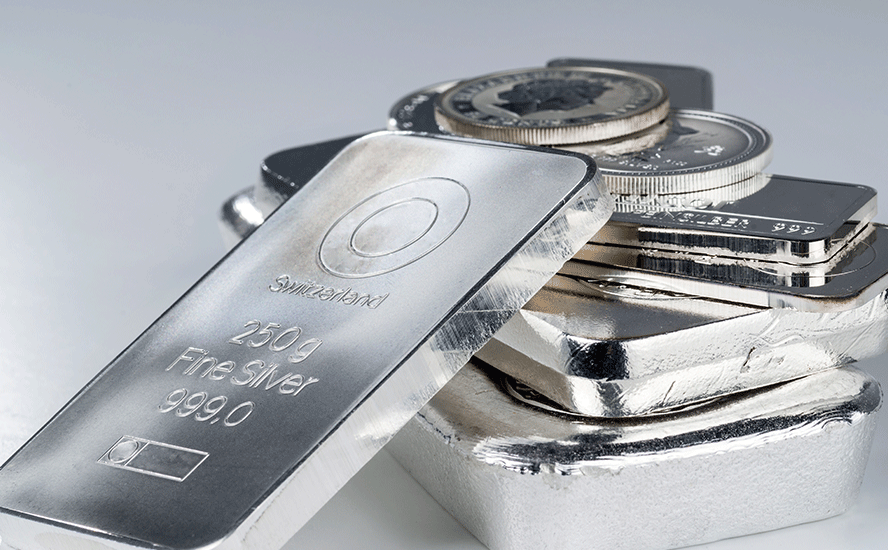
According to the Silver Institute’s annual silver survey, in 2018, the latest data available, there were 2.457 billion ounces of silver being held in vaults, silver ETFs or ETPs, government silver holdings and industrial silver stockpiles.
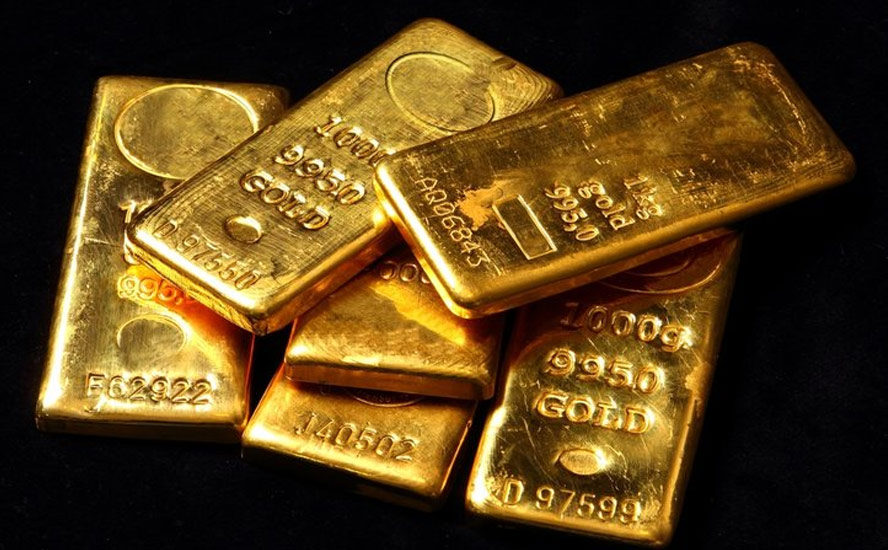
There are just slightly more than 6.1 billion troy ounces of gold above ground. Approximately 50% of gold is jewelry, and 40% is .999 fine bullion – or 2.5 billion ounces of gold currently available for investment purposes.
The all time estimated mined Gold-Silver ratio is about 8.8.1 – for every 8.8 ounces of silver mined we have mined 1 ounce of gold. We would expect there to be roughly eight times more silver than gold. But there isn’t, instead above ground stocks of investment grade gold and silver bullion are virtually even.
Industrial demand for silver is the reason for the flip-flop. The white metal is used in a mind-boggling 10,000 industrial applications.
While most of the mined gold is still around, either cast as jewelry, or smelted into bullion and stored for investment purposes, the same cannot be said for silver. It’s estimated around 60% of silver is utilized in industrial applications, leaving only 40% for investing. And of the 60% demanded by industry, 8 of 10 ounces is either used up in manufactured products or discarded in landfills. Some silver researchers say closer to 90% has been lost to landfills. Perhaps we should be mining them?
In sum, both silver and gold have roughly the same amount above-ground supply available for investment purposes. However, since very little gold is used by industry, it trades as an investment commodity – moving up and down in relation to factors like the US dollar, inflation, interest rates and sovereign bond yields.
In comparison, silver has a relatively small amount for investment, just 40% of total supply. Because over half of global supply is needed for industrial applications, silver trades much more like an industrial metal than an investment commodity. As we shall see in the section below, when gold is over-valued compared to silver, investors take advantage of the arbitrage opportunity, by selling some of their gold holdings to buy silver.
This also explains silver’s volatility. Because the investment market for silver is so small (60% is locked up in industrial uses) it swings up and down wildly with relatively low volumes.
Companies that are buying silver as a manufacturing input can’t risk buying it on the spot market; this would be too unpredictable.
Record demand
A record amount of silver was sought in 2018. According to the Silver Institute’s annual survey, total physical demand last year rose 4% to 1,033.5 million ounces – a three-year high. The need for silver was driven mostly by purchases of bars and coins, jewelry and silverware.
Unlike gold which serves primarily an investment function and as material for jewelry (known as “the fear trade and the love trade”), silver’s properties make it ideal for a number of applications – almost as many as oil. The metal is strong, malleable and conducts heat and electricity better than any other material. Gold also has these properties but it is too expensive to use in circuit boards, solar panels, electric cars, etc.
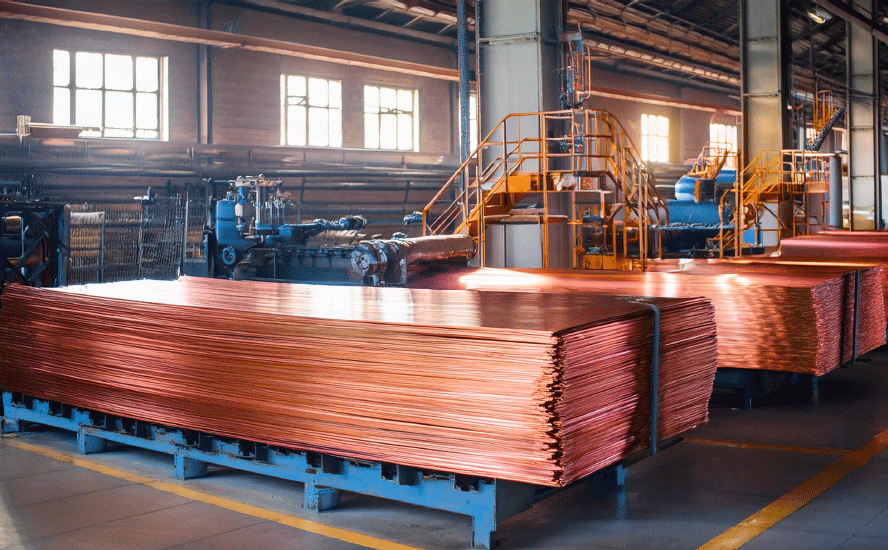
Over 50% of silver demand comes from industrial uses like solar panels, electronics, the automotive industry and photographic applications.
Despite the increased imperative for installing solar power as a means of moving away from carbon-intensive coal and natural gas, silver’s use in the photovoltaic sector actually dropped 1% last year. According to the 2019 World Silver Survey, that was due to “reduced silver loadings in solar modules”, but the drop was compensated for by solid demand from electronics, brazing alloys and solders.
And while companies have managed to reduce the amount of silver in solar panels, a practice known as “thrifting,” photovoltaics will remain a critical sector for silver, says Johann Wiebe, lead analyst at the GFMS Team/Refinitiv, the research firm behind the survey.
“Solar power capacity is expected to continue to grow and that is going to have a stronger impact on demand than the effects of thrifting,” he told Kitco News.
The solar power industry currently accounts for 13% of silver’s industrial demand.
Falling mine supply
The amount of silver produced from mines fell by 21.2 million ounces last year, the third consecutive drop after 13 years of uninterrupted supply growth. The 2019 World Silver Survey attributes the 855.7Moz loss to falling production at lead and zinc mines; 75% of silver is mined as a by-product, mostly of gold, copper, lead and zinc.
Two examples are the suspension of the mining license at Tahoe Resources’ Escobar mine in Guatemala – the world’s third largest silver mine – and reduced output due to a forest fire near Trail British Columbia. Unexpected maintenance issues and lower grades at the Fire Creek and Kid Creek mines drove US silver production down by 5.7Moz, 17% less than 2017.
As for 2019, mine supply from the top three silver-producing countries, Peru, Chile and Mexico, all dropped in the first half of this year. Data collected from each country showed Peru’s H1 silver production was down 10%, Chile fell 7% and Mexico saw a 4% decrease from January to May.
Analytics company GlobalData crunched the silver numbers and came out with a positive outlook for silver producers, right up until 2023. The firm says that year, global silver production should top a billion ounces (compared to 920Moz in 2018), with 50 new projects in the pipeline expected to produce silver either as a primary or secondary metal. The largest mines to come online in the next three years include the El Cajon mine in Mexico, Lundin Gold’s Fruta del Norte and the Mirabel mine in Ecuador, plus the Oernoe and Udokan mines in Russia.
Silver output in 2019 is expected to decline to 913.5Moz.
The gold-silver ratio
The gold-silver ratio is simply the amount of silver one can buy with an ounce of gold. Simply divide the current gold price by the price of silver, to find the ratio.
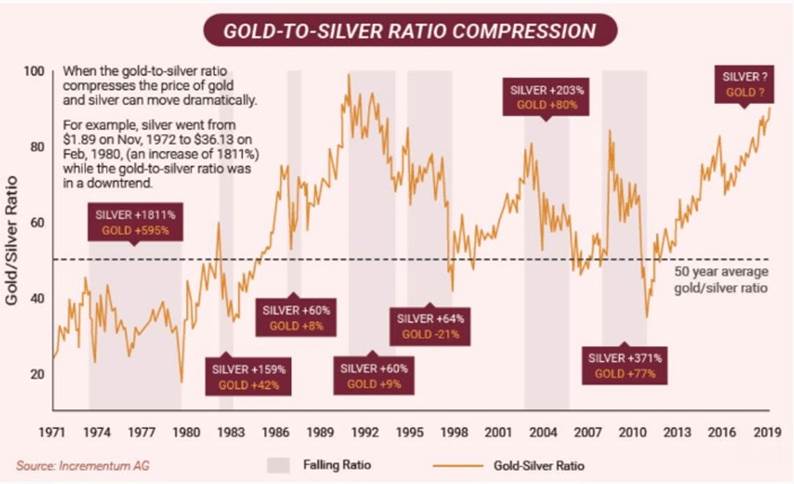
On June 12, the gold-silver ratio hit a 26-year high by breaking through the 90-ounce mark – meaning it took over 90 ounces of silver to purchase one ounce of gold. The higher the number, the more undervalued is silver or, to put it another way, the farther gold is pulling away from silver, valued in dollars per ounce.
Over time, this is exactly what has happened.
A reading of history tells us that in ancient Egypt, the two metals were practically equals, with only 2.5 parts silver equivalent to 1 part gold. Meaning that in 3,200 BC, you could trade 5 ounces of silver for 2 oz of gold. Imagine that! If somebody took that trade today, 5 oz of silver valued at $15 per ounce would cost the buyer $75, and the seller would be parting with 2 oz of gold worth $2,800.
When the Spanish conquistadors raided the Aztec empire the gold-silver ratio established in the Edict of Medina was 10.07 parts silver for 1 part gold. In the Middle Ages it was 12:1, and under France’s monetary standard in the 19th century, the ratio was set at 15.5:1. After silver was demonetized, in favor of the gold standard, silver took quite a hit; the ratio spiked to 30 at the beginning of the 20th century and has averaged 58.5 since the dollar peg was removed from the gold price by President Nixon in 1971, reports Bullion Vault.
So what does the gold-silver ratio mean and how can we use it? In the simplest terms, the gold-silver ratio tells us, as precious metals investors, which is under-valued, silver or gold? Which is over-valued, silver or gold?
The way to make money is to trade “on the extremes” of the ratio. For example at the current ratio of 84:1, a trader who has an ounce of gold could sell his gold for 84 ounces of silver.
The Balance explains this rather well, and gives a couple of historical examples.
Watching the silver to gold ratio can provide extremely useful insights into both precious metals.
Historically, it would have taken approximately 30 to 40 ounces of silver to buy one single ounce of gold.
This typically means that a ratio above 60 represents undervalued silver, while a ratio below 20 demonstrates undervalued gold.
In 1915, you could have traded 38 ounces of silver in exchange for one single ounce of gold. In 1940, near the beginning of World War II, gold soared as a safe haven asset, and the ratio was 97 to 1.
With inflation running wild in 1979, the Federal Reserve Chairman, Paul Volcker, raised interest rates to 21 percent. This resulted in driving down prices of gold, which eventually created the lowest-ever silver to gold ratio of 14.
While trying to predict future moves in the prices of the individual metals can be difficult, it may be much easier to invest based on the relationship between the two. When the silver to gold ratio is low (less than 30), then silver itself will typically rise faster than (or fall slower than) any moves you see in gold.
Gold and silver prices can move dramatically when the gold-silver ratio compresses.
Silver companies?
Recall that only 25% of silver production originates from primary silver mines. The rest is mined as a by-product of gold, copper, zinc and lead deposits. Silver exploration companies with pure-play silver projects are therefore rare, and typically trade at a premium to gold equities.
Companies with polymetallic mines that produce silver as a by-product are also highly desirable as an investment, especially during the current period of falling silver mine production.

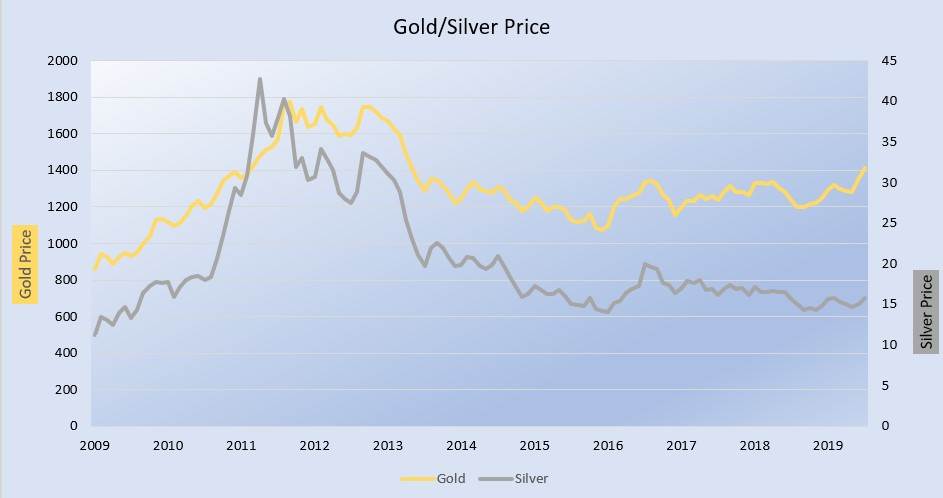
Adam Hamilton over at Zeal Intelligence does a great job of analyzing the silver sector’s performance in the second quarter, which coincides with gold’s recent run. Hamilton notes that Q2 numbers are a bit skewed because it took awhile for traders to be convinced that gold’s upleg was real. But he is optimistic about the third quarter especially considering how undervalued silver is right now. Here’s Hamilton:
The bottom line is the major silver miners had a challenging Q2. Silver languished the entire quarter, on its way to horrific quarter-century-plus lows relative to gold. Silver didn’t start perking up until mid-July, after gold’s decisive bull-market breakout had lasted long enough to convince traders gold’s upside was real and sustainable. So silver miners’ operating cash flows and earnings were way down last quarter.
That will really change in Q3 as long as silver doesn’t plummet into quarter-end. It’s incredible how fast silver miners’ fundamentals improve with higher silver prices. And silver’s upside potential is enormous, as it has a vast way to go to normalize relative to prevailing gold prices. The more that precious-metals sentiment improves, the more capital will flow into the tiny silver sector catapulting miners’ stocks far higher.
Conclusion
This article has hopefully shown how silver, despite being 17.5 times more abundant than gold in the earth’s crust, is just as rare, maybe even rarer than gold, when it comes to the availability of investment-grade, 0.999 fine bullion. There just isn’t a lot of it out there, given that 60% of silver is used by industry.
Both metals each have about 2.5 billion ounces currently available. The difference between them is that 60% of silver’s supply is going to be used by industry – not bought by investors – and either lost to manufacturing or landfilled.
Demand for silver has never been better and mined supply is shrinking, which should put a floor under silver prices, which have seen a bottom-to-top gain (spot silver) of 28% over the past six months.
At Ahead of the Herd, we believe that the best way to benefit from silver prices going up is to invest in quality juniors that are either exploring for silver or have projects with silver as a by-product. History has shown that investing in silver juniors is the best leverage against a rising silver price.
Richard (Rick) Mills
subscribe to my free newsletter
aheadoftheherd.com
Ahead of the Herd Twitter
Legal Notice / Disclaimer
Ahead of the Herd newsletter, aheadoftheherd.com, hereafter known as AOTH.
Please read the entire Disclaimer carefully before you use this website or read the newsletter. If you do not agree to all the AOTH/Richard Mills Disclaimer, do not access/read this website/newsletter/article, or any of its pages. By reading/using this AOTH/Richard Mills website/newsletter/article, and whether or not you actually read this Disclaimer, you are deemed to have accepted it.
Any AOTH/Richard Mills document is not, and should not be, construed as an offer to sell or the solicitation of an offer to purchase or subscribe for any investment.
AOTH/Richard Mills has based this document on information obtained from sources he believes to be reliable but which has not been independently verified. AOTH/Richard Mills makes no guarantee, representation or warranty and accepts no responsibility or liability as to its accuracy or completeness. Expressions of opinion are those of AOTH/Richard Mills only and are subject to change without notice. AOTH/Richard Mills assumes no warranty, liability or guarantee for the current relevance, correctness or completeness of any information provided within this Report and will not be held liable for the consequence of reliance upon any opinion or statement contained herein or any omission. Furthermore, AOTH/Richard Mills assumes no liability for any direct or indirect loss or damage or, in particular, for lost profit, which you may incur as a result of the use and existence of the information provided within this AOTH/Richard Mills Report.
AOTH/Richard Mills is not a registered broker/financial advisor and does not hold any licenses. These are solely personal thoughts and opinions about finance and/or investments – no information posted on this site is to be considered investment advice or a recommendation to do anything involving finance or money aside from performing your own due diligence and consulting with your personal registered broker/financial advisor. You agree that by reading AOTH/Richard Mills articles, you are acting at your OWN RISK. In no event should AOTH/Richard Mills liable for any direct or indirect trading losses caused by any information contained in AOTH/Richard Mills articles. Information in AOTH/Richard Mills articles is not an offer to sell or a solicitation of an offer to buy any security. AOTH/Richard Mills is not suggesting the transacting of any financial instruments but does suggest consulting your own registered broker/financial advisor with regards to any such transactions
Legal Notice / Disclaimer
Ahead of the Herd newsletter, aheadoftheherd.com, hereafter known as AOTH.Please read the entire Disclaimer carefully before you use this website or read the newsletter. If you do not agree to all the AOTH/Richard Mills Disclaimer, do not access/read this website/newsletter/article, or any of its pages. By reading/using this AOTH/Richard Mills website/newsletter/article, and whether you actually read this Disclaimer, you are deemed to have accepted it.

