Playing the gold ratios game

2019.07.13
There are some well-worn relationships between gold and certain variables, that forecasters look at when trying to time a move in or out of gold, and gold equities.
We know for example that gold has an inverse relationship with the US dollar. This makes sense because when the dollar falls, the values of other currencies rise. Demand for all commodities including gold increases, because these countries now have more of their own currencies with which to buy commodities, that are priced in USD. Higher demand for commodities (including gold) raises their prices. Those who are buying dollars as an investment will turn to gold – and other safe-haven investments, like bonds – if the dollar drops.
Paper or “fiat” currencies are subject to inflationary pressures and over time, lose their value. In the US there was an increase in inflation for every decade except the Depression when prices shrunk nearly 20%. Between 1860 and 2015, the dollar experienced 2.6% inflation every year, meaning that US$1 in 1860 was equivalent to $27.80 in 2015. This also means that prices in 2015 were 2,828% higher than they were in 1860.
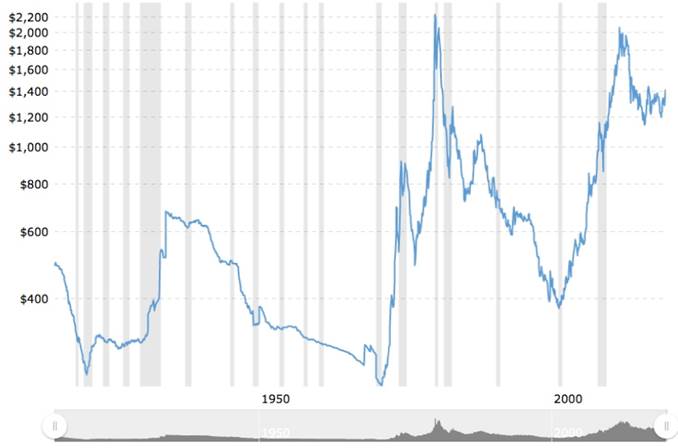
Oil and gold is another commonly tested ratio. An ounce of gold and a barrel of crude oil usually rise and fall in tandem, because rising oil prices lead to higher inflation, thereby pushing investors towards gold.
Since 1970, the average gold to oil ratio is around 15 – meaning it takes 15 barrels of crude to buy an ounce of gold.
The gold-silver ratio is a great way to time an investment into gold and out of silver, or vice-versa, without spending a penny. We’ll explain how below.
Finally, gold is matched to the Dow Jones Industrial Average, to try and predict whether the stock market is heading higher or lower. In this article we’re putting a microscope to gold ratios, to find out their utility as an investment tool.
Gold and stocks
On Friday gold followers will have noticed that prices took a dive, nosing as far down as $1,389 an ounce at one point in the trading session, before battling back $10 to close the week at $1,399.
This is normal considering Friday’s upbeat jobs report, which was a signal to the US Federal Reserve it may not have to raise interest rates, after hinting in June it may do so as soon as its next meeting, in July. Seeing the numbers, traders bet a rate cut will be delayed, or maybe not happen at all.
Here’s where it gets interesting. All three stock market indices fell on Friday, too. A healthy employment picture should give equities a boost, but because the market has been expecting a rate cut, (low interest rates means companies can borrow more and expand) stocks sold off on the spectre of that plan being derailed.
So we have gold and the stock markets falling in lock step on the release of economic data that is good for the economy. This isn’t the way it is supposed to work. Gold and equities normally move in opposite directions, just like gold and the dollar. Or do they?
In support of that idea, the standard view is that the two variables are negatively linked, because gold is a safe haven when the market tanks, and vice versa. There are lots of examples of that happening, such as the dot-com bubble forming in the second half of the 1990s, while gold limped along at $250 to $300 an ounce.
Between 1971 and 2017, the monthly correlation between the Dow Jones Industrial Average (DJIA) and gold prices was quite high at 0.74 (1.0 is an exact correlation).
However, there have also been times when a major stock market slump did not trigger a gold rally. One of the best examples is the financial crisis. When Lehman Brothers declared bankruptcy on September 15, 2008, gold actually dropped $150, from $885 to $735, within a month, before embarking on a major leg upward, to an all-time high of $1,873 in September, 2011.
How about silver? “The devil’s metal” (named for its volatility) is inversely related to the dollar and stock market downturns, like gold. But Sunshine Profits maintains there is a weak correlation, pointing to a chart of the two variables moving in the absence of any pattern since 1970, as evidence.
Back to stock markets and gold, we have already shown how these variables can align, if the economic conditions allow for it. CXO Advisory Group went into great detail in examining their movements.
The research firm started with the assumption that gold is an accurate indicator of the stock market’s long-term direction. It then measured the monthly ratio of the DJIA to gold price, in US dollars per ounce, from January 1971 to January 2019. The ratios ran from a low of 1.3 in January 1980 to a high of 42.2 in August 1999. The ratio in January 2019 was 18.9.
It found that very low ratios of DJIA/gold price boded well for the DJIA. However, there was zero correlation in predicting the future price of gold from the DJIA-gold price ratio.
The study then lengthened the sample period, to annual DJIA/gold price ratios in one data set, and to four-year periods in a third data set. Again there was no meaningful correlation, leading the researchers to conclude:
In summary, evidence from the past 47 years offers little support for belief that the ratio of DJIA to gold price reliably predicts stock market returns and no support for belief that the ratio predicts gold returns.

Bullion Vault is more sympathetic to a correlation between gold and stocks, noticing that for five-year periods, gold rose 59% of the time that the S&P 500 gained five years earlier, but climbed 98% of the time that the stock market dropped from a half-decade before.
It also noted that five-year losses for the stock market are common, using Friday afternoon closes as the sample period. Over the last 45 years, Bullion Vault found the S&P 500 closed lower on Fridays than 260 weeks (5 years) earlier nearly 25% of the time.
However, gold’s average five-year gain was 135%, measuring each Friday’s close against the close five years earlier.
Gold did even better if the stock market fell 20% or worse, measured across five-year periods. In these cases, such as the 41% sell-off the market suffered in early 2009, gold averaged 181% gains compared to five years earlier – and doubled or more on 80% of those occasions.
We’re not quite sure what the value is in correctly guessing what the market and the gold price are going to do in five-year increments, especially considering all the other variables that could throw off the correlation in predicting that far in advance, such as interest rate hikes, currency fluctuations, trade wars, border skirmishes, shooting wars, etc.
However there is some value in knowing whether or not the stock market is over-valued or under-valued compared to gold. Especially for investors who like to invest in the indices, knowing that the Dow is very overvalued compared to gold could be a signal to lighten up on DJIA shares, maybe cash them in and use the proceeds to purchase physical gold or gold company stocks.
For what it’s worth, the DJIA/gold price ratio was 19.2 on Monday – suggesting the Dow is currently slightly overvalued compared to bullion. You think? Since the US went off the gold standard, the Dow/gold ratio bottomed at 1.2 per ounce in 1980, peaked at 43 ounces in 1999, and averaged 15 ounces, states Bullion Vault.
Gold-silver ratio
Gold and silver prices are often compared, to get a sense of which direction each are headed. The gold-silver ratio is simply the amount of silver one can buy with an ounce of gold. Simply divide the current gold price by the price of silver, to find the ratio.
On June 12, the gold-silver ratio hit a 26-year high by breaking through the 90-ounce mark – meaning it took over 90 ounces of silver to purchase one ounce of gold. The higher the number, the more undervalued is silver or, to put it another way, the farther gold is pulling away from silver, valued in dollars per ounce.
Over time, this is exactly what has happened, as shown in the historical gold-silver ratio chart below.
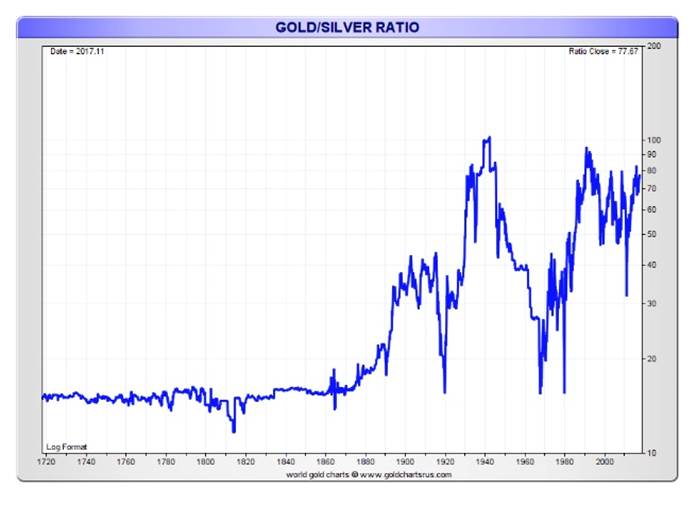
A reading of history tells us that in ancient Egypt, the two metals were practically equals, with only 2.5 parts silver equivalent to 1 part gold. Meaning that in 3,200 BC, you could trade 5 ounces of silver for 2 oz of gold. Imagine that! If somebody took that trade today, 5 oz of silver valued at $15 per ounce would cost the buyer $75, and the seller would be parting with 2 oz of gold worth $2,800.
When the Spanish conquistadors raided the Aztec empire the gold-silver ratio established in the Edict of Medina was 10.07 parts silver for 1 part gold. In the Middle Ages it was 12:1, and under France’s monetary standard in the 19th century, the ratio was set at 15.5:1. After silver was demonetized, in favor of the gold standard, silver took quite a hit; the ratio spiked to 30 at the beginning of the 20th century and has averaged 58.5 since the dollar peg was removed from the gold price by President Nixon in 1971, reports Bullion Vault.
Silver’s current undervaluation compared to gold “reflects a lack of investor belief in silver’s upside credentials…reaffirmed by the current price performance for silver, which appears lacklustre against a backdrop of rising (albeit modest) safe haven demand for precious metals,” writes Metals Focus, a consultancy. It adds that falling imports of silver into India are also weighing on prices.
A third major problem for silver right now is its use as an industrial metal. Because silver is used in such a wide range of applications compared to gold, such as in electronics, solar panels, photographic equipment, medicine, dentistry and jewelry, it is far more vulnerable to global growth fluctuations, the forecasts of which are currently weak. Industrial use of silver accounts for nearly 60% of annual demand compared to 10% for its yellow-metal sister.
So what does the gold-silver ratio mean and how can we use it? In the simplest terms, the gold-silver ratio tells us, as precious metals investors, which is under-valued, silver or gold? Which is over-valued, silver or gold?
The way to make money is to trade “on the extremes” of the ratio. For example at the current ratio of 93:1, a trader who has an ounce of gold could sell his gold for 93 ounces of silver.
The Balance explains this rather well, and gives a couple of historical examples.
Watching the silver to gold ratio can provide extremely useful insights into both precious metals.
Historically, it would have taken approximately 30 to 40 ounces of silver to buy one single ounce of gold.
This typically means that a ratio above 60 represents undervalued silver, while a ratio below 20 demonstrates undervalued gold.
In 1915, you could have traded 38 ounces of silver in exchange for one single ounce of gold. In 1940, near the beginning of World War II, gold soared as a safe haven asset, and the ratio was 97 to 1.
With inflation running wild in 1979, the Federal Reserve Chairman, Paul Volcker, raised interest rates to 21 percent. This resulted in driving down prices of gold, which eventually created the lowest-ever silver to gold ratio of 14.
While trying to predict future moves in the prices of the individual metals can be difficult, it may be much easier to invest based on the relationship between the two. When the silver to gold ratio is low (less than 30), then silver itself will typically rise faster than (or fall slower than) any moves you see in gold.
Even better is this six-minute video explaining how trading silver for gold and vice versa at the right times (generally at the gold-silver ratio highs and lows) over several years can reap big-dollar gains. The best part is, the investor is able to do this by spending ZERO money.
Gold-oil ratio
Another way to tell if gold is fairly valued, is to look at the ratio of gold to crude oil. As mentioned at the top, conventional wisdom holds that gold and oil prices rise in tandem because of oil’s inflationary effects on the economy, which in turn influence the gold price. However a commentary in Kitco shows the relationship is more complicated than that, with ratios varying from lows of <8 barrels of oil needed to buy an ounce of gold, to >30 barrels needed, throughout a period stretching from 1970 to 2018.
For example prior to the financial crisis, gold and oil prices both rose, in line with the commodities bull market that lasted five years, following 9/11. In March 2008 gold hit $1,008 per ounce and oil crested an all-time high of $145 per barrel. This point in time also marked the gold-oil ratio’s all-time low of 6.4.
The two commodities also fell together, after the collapse of Lehman Brothers. The financial crisis that followed saw gold crash to $714/oz, and oil plummet to $30/bbl.
Things shifted dramatically in 2014 when oil prices fell off a cliff. The WTI benchmark went from $106/bbl in June 2014 to $28/bbl in January 2016. Meanwhile gold became way overvalued compared to oil. During the three-year crude oil downturn, the ratio reached its highest-ever ratios, Kitco notes, at 38.5 and 37.8, in January and February of 2016.
How is all of this useful? Kitco’s commentator explains:
The gold to oil ratio is useful to determine if one commodity is valued fairly with respect to the other and is a useful parameter to predict future price movements. The ratio can also help determine the timing of speculations in the physical commodity itself, futures, options, and other derivatives, and/or equities and businesses that are part of the supply chain.
Conclusion
As precious metals investors, it is sometimes difficult to cut through all the noise in determining the actual values of gold and silver. Being investment metals, both are heavily influenced by the decisions, and expected decisions, of central banks – are interest rates going up or down? Will there be a stimulus program? Is inflation rising or falling? What about economic growth? Not just US growth but global growth?
Then there are the supply and demand factors which come into play. For gold, it’s not only the amount of gold demanded for investment purposes, but for gold jewelry – what is known as “the fear trade and the love trade”. Silver has an investment component but over half of demand is governed by industrial applications. Is the supply of gold and silver up or down? How much gold and silver is being produced from mines and how does that factor into their prices?
It can all be a tad overwhelming. That’s why it’s nice to have a few tried and true gold ratios to analyze. Historical charts help to plot the trends. Of the ones we have described, the most useful in our opinion is the gold-silver ratio. It can tell us not only whether one metal is fairly valued compared to the other, but it is also a means of determining when one’s valuation is so off-kilter compared to the other, as to present the opportunity for an extremely lucrative “inter-metal” trade.
In this current gold bull run, I have gold ratios and particularly, the gold-silver ratio on my radar screen.
Richard (Rick) Mills
subscribe to my free newsletter
Ahead of the Herd Twitter
Ahead of the Herd FaceBook
Legal Notice / Disclaimer
This article is copyright protected and may not be reproduced in whole or in part or retransmitted or reposted without the authors written permission.
This document is not and should not be construed as an offer to sell or the solicitation of an offer to purchase or subscribe for any investment. Richard Mills has based this document on information obtained from sources he believes to be reliable but which has not been independently verified. Richard Mills makes no guarantee, representation or warranty and accepts no responsibility or liability as
to its accuracy or completeness. Expressions of opinion are those of Richard Mills only and are subject to change without notice. Richard Mills assumes no warranty, liability or guarantee for the current relevance, correctness or completeness of any information provided within this Report and will not be held liable for the consequence of reliance upon any opinion or statement contained herein or any omission. Furthermore, I, Richard Mills, assume no liability for any direct or indirect loss or damage or, in particular, for lost profit, which you may incur as a result of the use and existence of the information provided within this Report.
Legal Notice / Disclaimer
Ahead of the Herd newsletter, aheadoftheherd.com, hereafter known as AOTH.Please read the entire Disclaimer carefully before you use this website or read the newsletter. If you do not agree to all the AOTH/Richard Mills Disclaimer, do not access/read this website/newsletter/article, or any of its pages. By reading/using this AOTH/Richard Mills website/newsletter/article, and whether you actually read this Disclaimer, you are deemed to have accepted it.


