Cypress has world class Clayton Valley Nevada lithium resource

2018.11.03
Today Cypress Development Corp (TSX-V:CYP) put out their long-awaited maiden resource estimate for their Clayton Valley Lithium Project in Nevada, and as we expected, it’s a monster. Earlier Ahead of the Herd did some back-of-the-napkin calculations on how large this combination brine and hard rock lithium deposit could be, and came up with a conservative estimate of 4.5 million tonnes lithium carbonate equivalent (LCE), contained within the estimated 857,500-tonne claystone lithium deposit. Well it turns out our numbers were low. The resource estimate is actually 1.3 billion tonnes of lithium that contains 6.4 million tonnes of LCE, including 2.857 million tonnes LCE in the indicated category and 3.683MT LCE inferred.
I’ve been covering lithium exploration since 2009, and this is the largest new lithium resource I’ve ever seen discovered. It stacks up against the best and highest grade lithium deposits even from the “Big Four” – Albemarle, FMC, SQM and Talison Lithium – the latter which mines the largest pegmatite-hosted hard rock lithium mine in the world, Greenbushes in Australia. The rest are lithium brine producers focused mostly on the “lithium triangle” of Chile, Argentina and Bolivia.
We’ll get into the resource estimate in detail further down, but first, some background on where we started with lithium and how we got here. Resource estimates always sound impressive but they are meaningless without some perspective. The second part of this article will show the largest lithium deposits in the world compared to Cypress’ Dean and Glory properties in Nevada. By the end of it we think you’ll agree that Cypress has something so unique and so valuable in the lithium space that it warrants the market’s full attention. This company and what they have under their 4,220 acres of ground could change the lithium space forever and put the Clayton Valley back on the map as one of the most important lithium-producing regions of the world.
Lithium the metal
The lightest metal on earth, lithium is used in batteries, ceramics, glass, metallurgy, pharmaceuticals and polymers. Most lithium is either produced from brines or pegamites, with the leading brine producer being Chile and Talison Lithium’s Greenbushes mine in Australia producing the largest amount of pegamite-hosted lithium. Other sources of lithium include clays, geothermal brines, oilfield brines and zeolites.
The EV revolution
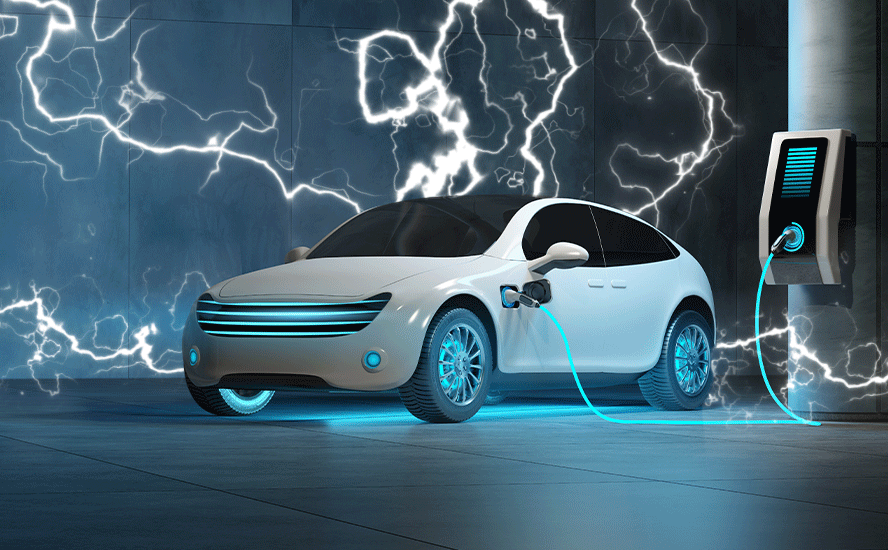
While modern electric vehicles have existed as prototypes and with very limited commercial production since the 1990s (General Motors’ EV1 – for a great history watch Who Killed the Electric Car?), the real momentum in the switch from cars equipped with gas and diesel-powered internal combustion engines to vehicles powered with lithium-ion batteries started in 2009 by then-President Obama. Obama announced his Administration was putting aside $2.4 billion in order for American manufacturers to produce hybrid electric vehicles and battery components.
“This investment will not only reduce our dependence on foreign oil, it will put Americans back to work. It positions American manufacturers on the cutting edge of innovation and solving our energy challenges,” Obama said at the time. Notable that both gasoline and oil prices were high and the US had not yet started the shale oil and gas revolution whose rapid production from fracking and horizontal drilling would crash oil prices five years later. The point being, Obama’s electrification program was seen as a way to spark US ingenuity, start a new industry that would provide much-needed jobs following the 2008 recession, and make the US less energy-dependent. The lifting of the ban on US oil exports didn’t occur until 2015 so the US in 2009 was still importing most of its oil from Canada and the Middle East.
Of course Tesla was a few years ahead of Obama, forming in 2003 and producing its first model, the all-electric Model S sedan, in 2008.
The reason for the electrification of the global transportation system is clear.
Electric vehicles have far fewer moving parts than gasoline-powered cars – they don’t have mufflers, gas tanks, catalytic converters or ignition systems, there’s also never an oil change or tune-up to worry about getting done. Plug and go, pretty convenient and very green!
But the clean and green doesn’t end there – electric drives are more efficient then the drives on ICE powered cars. They are able to convert more of the available energy to propel the car therefore using less energy to go the same distance. And applying the brakes converts what was wasted energy in the form of heat to useful energy in the form of electricity to help recharge the car’s batteries.
Electric vehicles are totally emission free. China, the world’s second-biggest economy, in a move to cap its carbon emissions by 2030 and curb worsening air pollution, said it will set a deadline for automakers to end sales of fossil-fuel-powered vehicles and push into the market led by Chinese EV juggernauts BYD and BAIC Motor Corp. India, France, Britain and Norway are doing the same.
But the key to EV market penetration has always been the batteries. How can they be made cheaply enough to complete with gas-powered vehicles, and with a reasonable range that doesn’t have the driver frantically searching for a charging station in the middle of nowhere? Part and parcel to this question is lithium. Lithium carbonate and lithium hydroxide are key component of the lithium-ion battery cathode, making it an extremely sought-after battery component.
Lithium is among 23 critical metals President Trump recently deemed critical to national security, and signed a bill that would encourage the exploration and development of new US sources of these metals.
With just one producing lithium mine, Silver Peak in Nevada, the United States is vulnerable to foreign imports of lithium. The country currently imports most of the lithium that it consumes – with import reliance today pegged at greater than 70%.
Asia and particularly China are looking to lock up lithium supply, and are years ahead of North America in terms of EV penetration and battery supply chains. Last year China sold about 700,000 electric cars, 200,000 more than 2016. Government subsidies to EVs have been reduced by 20%. The Middle Kingdom sees EVs as the key to unlocking the pollution dilemma that has plagued its car-choked cities. China represents over a quarter of the global EV market, and will own 40% by 2040 according to the International Energy Agency (IEA).
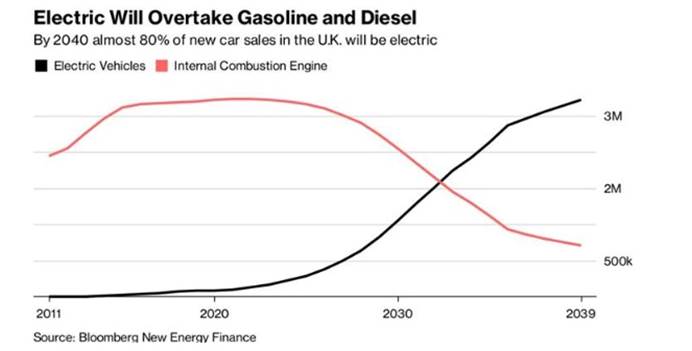
The country has signed lithium offtake agreements with mines in Australia, Canada and Africa, and despite Tianqi Lithium – which owns 51% of Talison’s Greenbushes mine in Australia, the largest hard rock lithium mine in the world – being recently denied a 32% ownership stake in SQM, China isn’t giving up. Other Asian companies, such as Japan’s Panasonic and Korean conglomerate Samsung, are also looking to ink deals in the lithium triangle of Chile, Argentina and Bolivia. China and India are both going to 100% electric vehicles. Every major car manufacturer has electric models. Volvo has even promised to phase out internal combustion engines (ICE) from 2019. France has promised to end the sale of gasoline and diesel vehicles by 2040; the UK quickly followed suit. Almost a third of cars sold in Norway in 2016 were electric and Germany could outpace its neighbors as Volkswagen aims to become a leader in both EVs and automated vehicles. EVs surpassed 2 million units in 2016 and Bloomberg New Energy Finance predicts they will make up an astounding 54% of new car sales by 2040.
Demand outstripping supply
In 2016, Chinese carmakers sold 28.03 million cars. If China follows through on its promise to go 100% electric that’s a minimum 28.03 million lithium-ion battery packs for EV’s per year. Add in the UK’s 2.7 million car sales in 2016 and France’s 2 million car sales in 2016. That’s 32.73 million electric vehicles all requiring lithium-ion battery packs, without counting electric buses (a big deal in China, and going to be in India as well) or annual growth rates in auto sales. One Tesla car battery uses 45 kg or 100 pounds of lithium carbonate.
If each used the same amount of lithium carbonate as Tesla’s electric vehicles, that’s 1.487 billion kilograms/ 3.273 billion pounds or 1,487,727 tonnes /1,636,500 tons of new lithium carbonate demand. Current annual production of lithium carbonate equivalent (LCE), for all purposes, stands at about 230,000 metric tonnes.
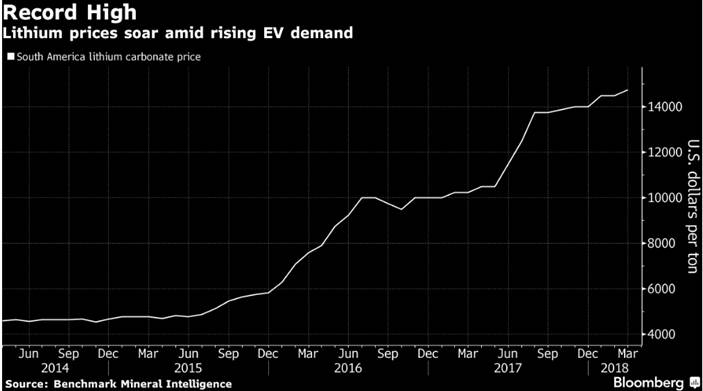
The expectation of new demand overwhelming supply has seen the price of the energy metal taking off. Lithium carbonate prices haven nearly tripled over the past two and a half years, from about $5000 a tonne to over $14,000 a tonne. Battery-grade lithium carbonate currently sells for around $23,000 a tonne.
The world’s lithium supply
So where does most of the world’s lithium come from? There are two primary means of extracting lithium: from brines in evaporated salt lakes known as salars, and hard rock mining, where the lithium is mined from granite pegmatite orebodies containing spodumene, apatite, lepidolite, tourmaline and amblygonite.
The Puna plateau sits at an elevation of 4,000m, stretches for 1800 km along the Central Andes and has a width of 350 to 400 km. The Puna covers a portion of Argentina, Chile and Bolivia and hosts an estimated 70 to 80% of global lithium brine reserves. The Salar de Atacama, the Salar de Uyuni and the Salar de Hombre Muerto are often referred to as the Lithium Triangle.
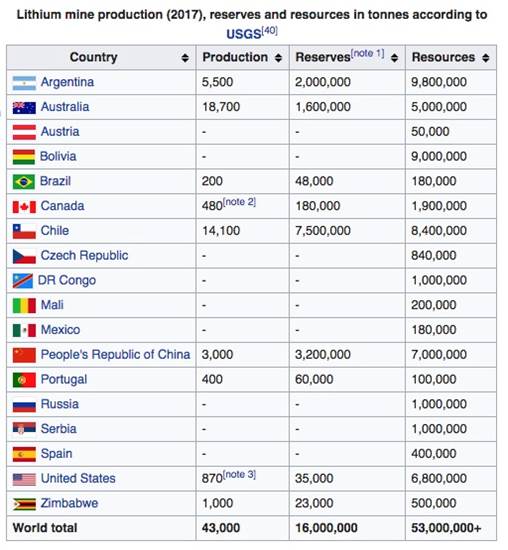
As mentioned the Greenbushes mine produces a large amount of lithium and is currently the biggest hard-rock lithium mine in the world, making Australia the world’s largest lithium producer. According to the USGS, the next three are, in order, Chile, Argentina and China. The United States has the fifth largest lithium resources but is far down the list in terms of production.
 While most of the world’s lithium is produced by four companies – SQM, FMC, Albemarle and Talison Lithium – there are a few others worth mentioning. According to a list put together by Mining Global, the 10 largest companies and their main projects are, in reverse order:
10. Wealth Minerals – Laguna Verde in Salar de Atacama, Chile
9. Galaxy Resources – Sal de Vida, Argentina
8. Nemaska Lithium – Whabouchi mine, Canada
7. MGX Minerals – 1.7 million acres of brine resources extracted from spent oilfields
6. Lithium Americas – Cauchari-Olaroz, Argentina
5. Jiangxi Ganfeng Lithium – Mt. Marion mine, Australia
4. Sichuan Tanqi Lithium – Greenbushes, Australia; Zhabuye Salt Lake, Tibet
3. FMC – Salar del Hombre Muerto, Argentina
2. SQM – Salar de Atacama, Chile; Cauchari-Olaroz, Argentina
1. Albemarle – Salar de Atacama, Chile; Greenbushes mine, Australia; Silver Peak, USA
From here we can look at the resources of some of the top lithium mines and compare them to what Cypress has.
Resource comparisons
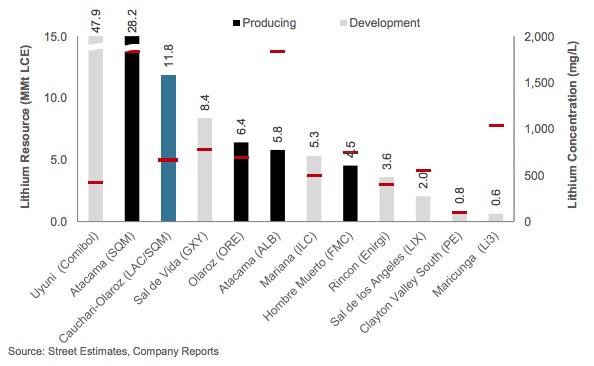
From the chart above, courtesy of an investor presentation by Lithium Americas, we need to pay attention to the white bars which are deposits still being developed versus black bars which are producing lithium mines. We can see that the largest undeveloped deposit is the Salar de Uyuni in Bolivia by Comibol, followed by SQM’s brine operations in the Salar de Atacama, the Sal de Vida being developed by Galaxy Resources in Argentina, and the SQM/ Lithium Americas JV to develop the Cauchari-Olaroz deposit, also in Argentina. We also added in Greenbushes in Australia, and two North American comparisons, the Whabouchi mine in Quebec and Pure Energy’s Clayton Valley project next to Albemarle’s producing Silver Peak lithium mine.
Salar de Uyuni
The 4,000-square-mile Salar de Uyuni is the world’s largest salt flat and unexploited lithium deposit. The Bolivian government claims the Bolivian Andes could harbor 70% of the world’s lithium, but there are problems. Lithium contained in Bolivian salars are higher in altitude, not as dry, and contain more magnesium (Mg) and potassium than in neighboring Chile, making the extraction process much more complicated, and costly.
The Salar de Uyuni (Bolivia) has the lowest average grade of Li at .028 and has an extremely high ratio of Mg/Li at 19.9. The Mg has to be removed by adding slaked lime to the brine – the slaked lime reacts with the magnesium salts and removes them from the water. If the ratio is 1:1 in the original brine, then the added cost is, if slaked lime is $180/tonne, $180t of lithium carbonate produced. At 20:1 the extra production cost would be $3,600.00 per ton.
Uyuni’s higher rainfall and cooler climate means that its evaporation rate is not even half that of Atacama’s. A major factor affecting capital costs is the net evaporation rate – this determines the area of the evaporation ponds necessary to increase the grade of the plant feed. These evaporation ponds can be a major capital cost. The Salar de Atacama has higher evaporation rates (3200 mm pan evaporation rate per year (py) and <15 mm py of precipitation) than other salt plains in the world and evaporation takes place all year long.
The lithium in the Uyuni brine is not very concentrated and the deposits are spread across a vast area. Bolivia also has limited infrastructure – compared to that of Chile, Argentina or the US – and they lack free access to the sea.
Oddly, or maybe not so odd, none of this was mentioned in the recent story announcing that Bolivia has partnered with German company ACI Systems to manufacture and market lithium batteries.
The LCE numbers should be taken with a grain of salt, pardon the pun. Estimates of the amount of lithium contained in the Salar de Uyuni vary wildly from just 9 million tons, from the USGS, to 140 million tons. And despite Bolivian President Evo Morales’ pledge to develop the lithium industry, little has happened since his re-election in 2009. The Guardian reports just two projects underway on the Bolivian salt flats, a lithium carbonate project by German company K-UTEC Ag Salt Technologies and a battery manufacturing plant built by Linyi Dake Trade, a Chinese firm.
Salar de Atacama
The lithium brines of the Salar de Atacama contain 28.2 million tonnes of LCE according to the chart. The salar, a dried bed of an ancient Chilean lake, is one of the most barren places on earth and the largest salt flat in Chile. At 1.4 miles above sea level, the sun’s rays can damage exposed skin in minutes. SQM has over 44 kilometers of evaporation ponds and has been mining the salar since the 1990s. In 1984 Albemarle started producing lithium carbonate at its La Negra facility. According to an SQM investor presentation SQM has current capacity of 48,000 tonnes of lithium carbonate annually, with plans to expand to 70,000 this year and 100,000 in 2019.
Cauchari-Olaroz
In March 2016 Lithium Americas partnered with SQM to develop the Cauchari-Olaroz project in Argentina. According to Lithium Americas it’s the third largest lithium brine resource. A 2012 feasibility study showed a combined measured and indicated resource of 11.8 million tonnes LCE.
Sal de Vida
According to Galaxy Resources, the Sal de Vida deposit in northwest Argentina has a JORC-compliant reserve estimate of 1.1 million tonnes lithium carbonate equivalent (LCE) and 4.2 million tonnes of potassium chloride. The resource estimate as seen in the chart above is pegged at 8.1 million tonnes LCE.
Greenbushes mine
Mining at Greenbushes in Australia first started with tin in the 1880s but switched to tantalum in the early 1990s. Lithium mining is relatively recent with Greenbushes Limited commissioning a 30,000 tonnes per annum concentrator in 1984-85. The mine is now operated by Talison Lithium which is owned jointly by Albemarle and China’s Tianqi Lithium. The mine located 250 kilometers from Perth in Western Australia has a measured and indicated resource of 118.5 million tonnes of spodumene ore graded 2.4% lithium, which contains about 7.13 million tonnes of LCE, according to a 2012 NI 43-101 report. A $320 million expansion will more than double production capacity.
Whabouchi mine
Released in January, the new feasibility study for Nemaska Lithium’s Whabouchi mine and concentrator in the James Bay region of Quebec, Canada, increased the mine life from 26 to 33 years. Nemaska plans to produce lithium carbonate and lithium hydroxide from the spodumene hard rock lithium deposit. According to the study 7 million tonnes of spodumene concentrate will be converted into 770,000 tonnes of battery-grade lithium hydroxide and 361,000 tonnes of LCE.
Clayton Valley Project (Pure Energy)
Currently Tesla has an agreement with Pure Energy Minerals to supply lithium hydroxide. Pure Energy’s lithium brine project is located in Clayton Valley adjacent to the Silver Peak mine. It has an inferred resource of 218,000 tonnes of LCE according to an NI 43-101 report filed in August, 2017. Pure Energy has calculated in a preliminary economic assessment annual production of 10,300 tonnes lithium hydroxide and 9,100 tonnes lithium carbonate equivalent (LCE).
Cypress Development Corp
Now to dive further into the resource estimate announced today by Cypress. We can see that in comparison to some of the world’s largest lithium deposits, Cypress is right up there, around the same as the Salar de Oroz lithium facility (the fifth largest deposit in the world according to the Lithium Americas chart) in Argentina which has a measured and indicated resource of 6.4 million tonnes LCE. The mine owned by Orocobre started production in 2015.
Of the estimated 1.3 billion tonnes of lithium estimated in Cypress’ Dean and Glory deposits, are 6.4 million tonnes of LCE – the same number quoted above for Salar de Oroz except Orocobre’s resource is measured and indicated while Cypress’ contains 2.857 million tonnes indicated and 3.683MT inferred.
The estimate is based on drill results from 23 holes completed by Cypress in 2017 and 2018. The deposit remains open at depth, with 21 of 23 holes ending in lithium mineralization, meaning the drills have plenty of room to run in expanding and growing the resource. In fact according to the company, it will take only another 30 more drill holes to convert the inferred portion of the resource (Ie. 779 million tonnes) to indicated, which could take the deposit well over a billion and a half tonnes and 7 million tonnes LCE.
The grades are also exceptional – 889 parts per million for the indicated mineral resource of 597 million tonnes and almost exactly the same, 888 ppm for the 779 million tonnes of inferred.
Of course, the size of a lithium deposit is of limited value if the metallurgy doesn’t work. In a recent article we discussed the difficulties of processing lithium, but in Cypress’ case the metallurgy looks relatively simple. The company has shown that lithium can be extracted from the claystones using a flow sheet whereby recoveries of 80% can be achieved in short leach times (4 to 8 hours) using conventional dilute sulfuric acid and leaching. The amount of sulfuric acid and reagents needed is relatively low, and being able to leach the lithium with acid avoids costly calcine and regrind of material during processing.
Now for the really interesting part – showing what Cypress is worth based on this long-awaited resource estimate. Earlier we did some rough calculations based on the takeout value of Lithium X back in December.
On December 18 Vancouver-based LIX was taken out by Chinese company Nextview New Energy Lion Hong Kong Ltd., in a deal valued at $265 million or $$2.61 a share. The main driver of the takeout was Lithium X’s flagship project in Argentina, located in the Lithium Triangle, from which Nextview plans to acquire the lithium needed to make electric vehicle batteries.
Lithium X’s Sal de Los Angeles project has an NI 43-101 resource of 1.04 million tonnes lithium carbonate equivalent (LCE) in the indicated category and 1.01MT inferred, for a total LCE resource of 2.05 million I&I tonnes. (Cypress has a slightly higher percentage of inferred to indicated, 2.8MT indicated versus 3.6MT inferred).
This news from Lithium X was extremely interesting, because we now know how much a larger company will pay for a lithium brine exploration property in Argentina with a battery-grade lithium resource. That number was fairly easy to calculate: take the buyout value of $265 million and divide it by the NI 43-101 indicated and inferred resource of 2 million tonnes LCE, and you get Cdn$132.50 a tonne. In other words, a tonne of LCE, in the ‘ground’ in today’s hot lithium market is worth 132.5 loonies.
My personal (not from Cypress, not 43-101 compliant and not to be relied on for an investment decision), back of the napkin resource calculation was 3,500 meters length X 2,000 meters width X 70 meters thick X 1.75 specific gravity (density) = 857,500,000 tonnes of lithium enriched claystone (approx. 4,500,000 tonnes of LCE).
I was off by a couple of million tonnes of LCE, but it’s never a bad thing when you underestimate the size of a monster resource and in my defence calculations were done early and based on just CYP’s Dean property.
Since we now know that the LCE estimate for Cypress is 6.4 million tonnes, we can calculate the approximate share value shareholders might receive if a buyout were to happen using LIX’s purchase metrics, which is the following:
Lithium X’s insitu (in ground) value of $132 a tonne x 6,540,000 tonnes LCE = $863,280,000 divided by CYP outstanding shares fully diluted (osfd) of 79,000,000 = Cdn$10.92 per share.
In other words, based on the resources we now know are in the ground, Cypress Development Corp could be worth nearly 11 bucks a share. When trading was halted on Monday, Cypress was last changing hands at $0.37. Cypress’ stock has a long way to go to reach anywhere near it’s fair value in a buyout, so hold on, this is going to be a fun ride.
Conclusion
Three years ago Cypress began prospecting in the Clayton Valley, home to Albemarle’s Silver Peak Mine, where it has been mining Nevada lithium brines for decades.
Cypress wasted no time in acquiring two land packages: the 1,520-acre Glory Project totaling 76 placer/lode claims located in Esmeralda County, and the 2,700-acre (35 association placer claims) Dean Project. With geological data in hand and two prospective properties acquired, Cypress started taking surface samples in September 2016. The samples returned results ranging from 340 parts per million (ppm) to 2,940 ppm, with an average grade of 925 ppm lithium carbonate equivalent (LCE). Drilling was conducted in 2017-18, and with assays returning with grades from 600 to 1,100 ppm, we knew we had something special. We just didn’t know the size of it. Now we do. The Clayton Valley Lithium Project is an elephant.
The sheer size of the resource means that a lot of attention will be focused on the company as it continues to expand the property, particularly beneficiation methods. With a million dollars in the kitty, Cypress is well-financed to fund its new exploration phase. We know that Silver Peak’s current capacity is only 6,000 tonnes of LCE per annum. We also know that Albemarle failed to deliver any new production to the market between 2012 and 2016, as we showed in a recent article. Could Cypress be the company that provides new lithium to the currently small, by mining standards, lithium market? But a market that is growing exponentially due to the demand for lithium with has been called the “new gasoline” by Goldman Sachs? The possibility is certainly very real, and exciting.
Cypress has a non-hectorite claystone, starting at surface deposit in Nevada, USA. No tariffs, no trade war worries, next to the only producing lithium mine in the US and in the home state of Tesla’s Gigafactory, which needs lithium.
With its monstrous resource, high-grade lithium content, a superior location in regard to permitting and all the existing infrastructure in place, the uniqueness of the new deposit model, and with no competition in the Clayton Valley basin, I cannot wait to see what the market thinks of Cypress Development Corp’s resource estimate.
I have Cypress Development Corp, and what could be the biggest junior mining story of the year, on my radar screen. Do you?
If not, perhaps you should.
Richard (Rick) Mills
Just read, or participate in if you wish, our free Investors forums.
Ahead of the Herd is now on Twitter.
Legal Notice / Disclaimer
This document is not and should not be construed as an offer to sell or the solicitation of an offer to purchase or subscribe for any investment.
Richard Mills has based this document on information obtained from sources he believes to be reliable but which has not been independently verified.
Richard Mills makes no guarantee, representation or warranty and accepts no responsibility or liability as to its accuracy or completeness. Expressions of opinion are those of Richard Mills only and are subject to change without notice. Richard Mills assumes no warranty, liability or guarantee for the current relevance, correctness or completeness of any information provided within this Report and will not be held liable for the consequence of reliance upon any opinion or statement contained herein or any omission.
Furthermore, I, Richard Mills, assume no liability for any direct or indirect loss or damage or, in particular, for lost profit, which you may incur as a result of the use and existence of the information provided within this Report.
Richard owns shares of Cypress Development Corp (TSX.V:CYP)
Legal Notice / Disclaimer
Ahead of the Herd newsletter, aheadoftheherd.com, hereafter known as AOTH.Please read the entire Disclaimer carefully before you use this website or read the newsletter. If you do not agree to all the AOTH/Richard Mills Disclaimer, do not access/read this website/newsletter/article, or any of its pages. By reading/using this AOTH/Richard Mills website/newsletter/article, and whether you actually read this Disclaimer, you are deemed to have accepted it.
